
AI Coding Productivity Statistics 2026
A 16-developer METR trial measured 19% more task time with AI allowed, while trials run by AI tool vendors and developer surveys reported gains. We compare effect sizes by study design, self-reported and measured productivity, and results by affiliation.
Published October 24, 2026
In July 2025, the research nonprofit METR found that experienced open-source developers took 19% longer to finish tasks when AI tools were allowed in a 16-developer randomized trial, while trials run by AI tool vendors and developer surveys report gains. That split led us to study how much AI coding tools change developer output in published trials, field experiments, telemetry studies and surveys, and how strong each piece of evidence is.
Our analysts compiled 10 studies published from February 2023 to February 2026. The set includes three randomized controlled trials, one set of randomized field experiments at three companies, three observational telemetry studies and three developer surveys. We coded each study by design, sample size, population, metric, measured effect and the affiliation of its authors or publisher, using the rules in the methodology section. Where one study reported both what developers believed and what researchers measured, we set the two figures side by side.
In the following sections, we code every study, compare effect sizes by study design, look at the task-time trials and the company field experiments, review telemetry results on output and code quality, cover the DORA estimates and the 2024 and 2025 developer surveys, compare self-reported and measured productivity, and group the evidence by affiliation.
Key Findings
- In a 2023 GitHub Copilot trial with 95 developers randomized, the group with Copilot finished a JavaScript HTTP server task in 55.8% less time.
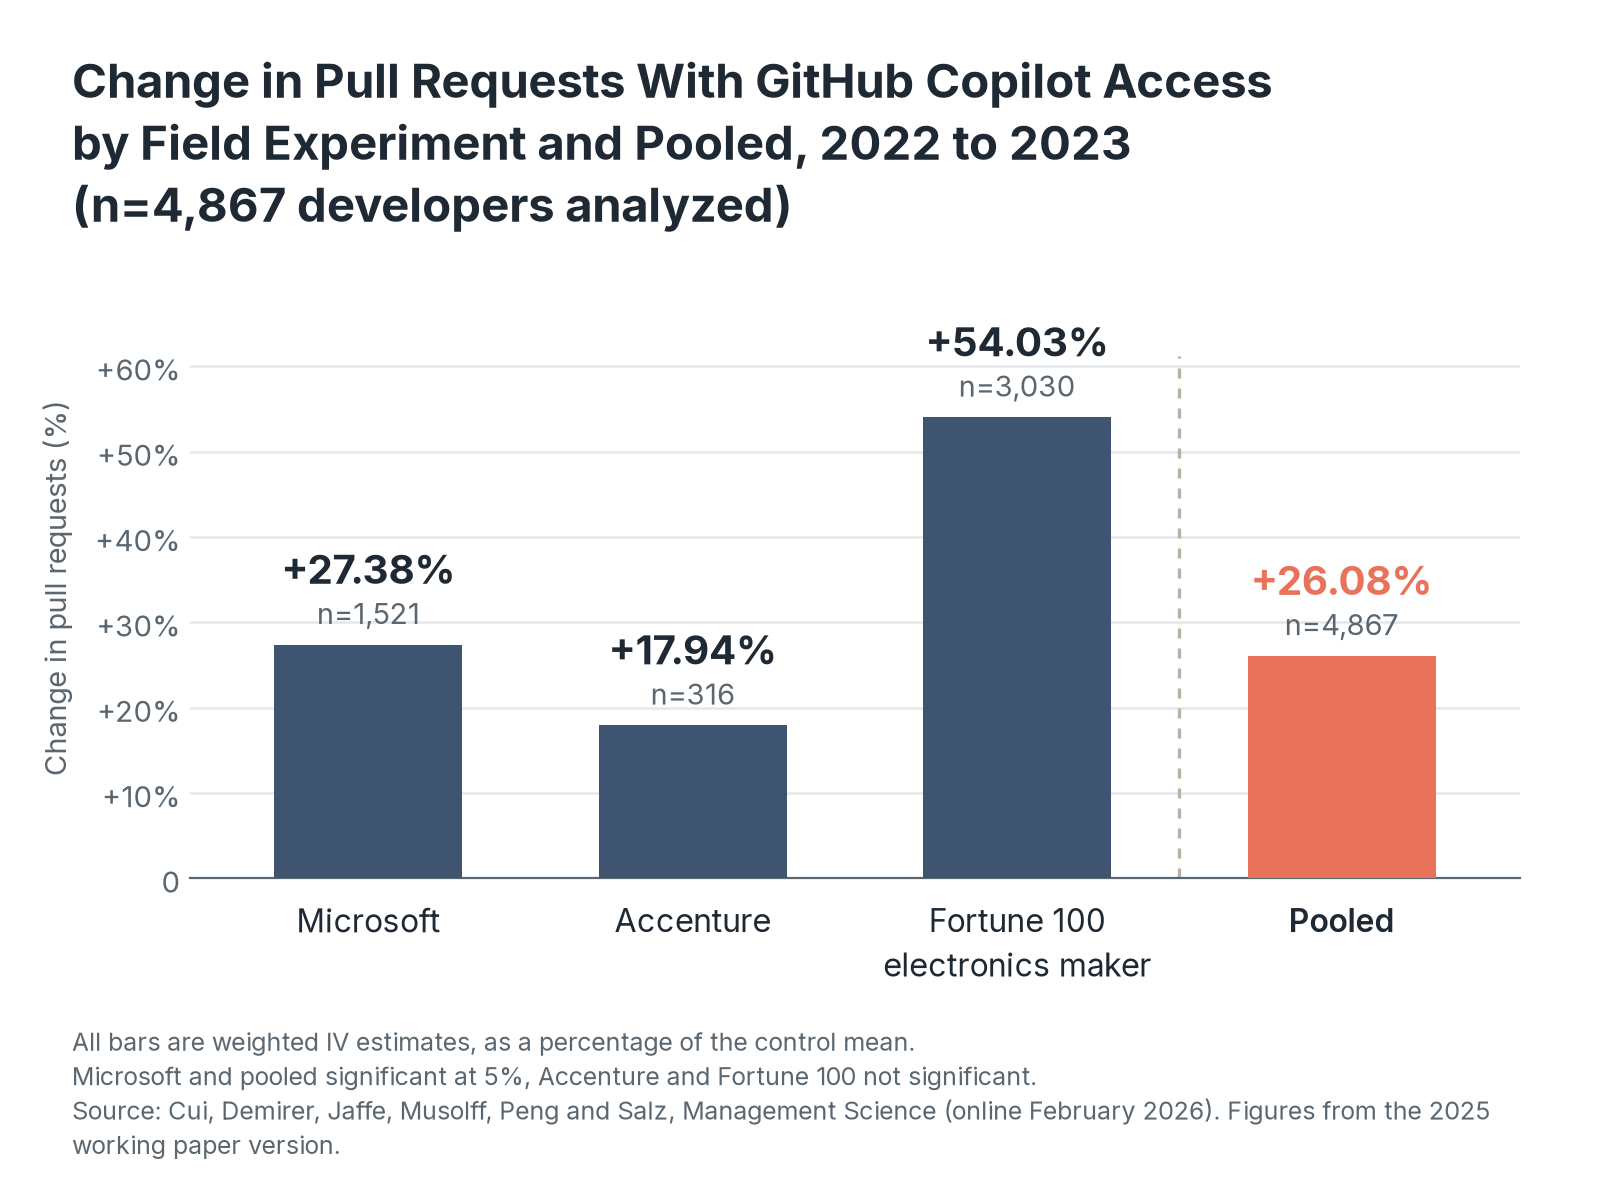
- In field experiments at Microsoft, Accenture and a Fortune 100 company from 2022 to 2023, GitHub Copilot access raised pull requests by 26.08% (pooled, 4,867 developers analyzed).
- In Uplevel's 2024 study of 785 developers (our calculation, 351 + 434), developers with Copilot access had a 41% higher bug rate in pull requests.
- In DORA's 2024 survey of nearly 3,000 technology professionals, 75% reported productivity gains from AI.
How We Coded Each AI Coding Productivity Study
This section lists every study in our dataset with the codes we assigned to it. Design, sample, population, metric and effect come from each source, and the affiliation code follows the employer of the authors or the organization that published the work.
| Study | Design | Sample | Population | Metric | Measured effect as published | Affiliation |
|---|---|---|---|---|---|---|
| METR (2025) | Randomized controlled trial | 16 developers, 246 tasks | Experienced open-source maintainers on their own repositories | Task time | 19% more time with AI allowed | Nonprofit research |
| Peng et al. (2023) | Randomized controlled trial | 95 developers randomized | Freelance developers recruited on Upwork | Task time | 55.8% less time | AI tool vendor (Microsoft, GitHub) |
| Google, Paradis et al. (2024) | Randomized controlled trial | 96 engineers | Full-time Google software engineers | Task time | About 21% less time, not significant (p=0.086) | AI tool vendor (Google) |
| Cui et al. (2026) | Field experiment | 4,867 developers analyzed (5,120 assigned) | Developers at Microsoft, Accenture and a Fortune 100 electronics maker | Pull requests | 26.08% more pull requests | AI tool vendor (Microsoft) |
| Uplevel (2024) | Observational telemetry | 785 developers (our calculation, 351 + 434) | Developers at several enterprise customers | Throughput and bugs | No significant throughput change, 41% higher bug rate | Engineering analytics vendor |
| Faros AI (2025) | Observational telemetry | More than 10,000 developers | 1,255 teams at multiple companies | Throughput and bugs | 98% more pull requests merged, 9% more bugs per developer | Engineering analytics vendor |
| GitClear (2025) | Observational telemetry | 211 million changed lines | Repositories in GitClear's code change dataset | Code quality | Copy/pasted lines from 8.3% to 12.3% of changed lines, 2020 to 2024 | Engineering analytics vendor |
| DORA (2024) | Self-reported survey | Nearly 3,000 respondents | Technology professionals worldwide | Perception and delivery | 75% report productivity gains from AI | AI tool vendor (Google) |
| DORA (2025) | Self-reported survey | Nearly 5,000 respondents | Technology professionals worldwide | Perception and delivery | More than 80% believe AI raised their productivity | AI tool vendor (Google) |
| Stack Overflow (2025) | Self-reported survey | 33,662 respondents | Developers and people learning to code worldwide | Perception | 52% say AI changed how they complete work (n=31,636 answering) | AI tool vendor (Stack Overflow) |
Source: AI Services Companies, AI Coding Productivity Study, October 2026. Uplevel's 785 is our calculation (351 with Copilot access plus 434 without). Data: ai-coding-study-coding.csv
- The 10 studies measure task time, output counts, code quality, delivery or perception, and a figure from one class cannot stand in for a figure from another. Each effect needs its metric beside it when it is cited.
Six of the 10 studies had authors employed by an AI tool vendor or were published by a vendor (our count, n=10 studies). Microsoft and GitHub employees wrote or co-wrote two of them, Google ran or wrote three, and Stack Overflow, which offers an AI-powered VS Code extension with its Stack Internal plans, published one. The four randomized studies together covered 5,074 developers (our calculation, 16 + 95 + 96 + 4,867), and 95.9% of them came from the field experiments (our calculation, 4,867 of 5,074). Among the three randomized controlled trials, METR's is the only one in which developers worked on issues from projects they already maintained. The Peng and Google trials gave every participant the same assigned task.
AI Coding Productivity Effect Size by Study Design
This section groups the 10 studies by design and compares the headline effects each group reported. Task-time trials report a percent change in time to finish a task, field experiments and telemetry report changes in output or quality, and surveys report what share of respondents perceived a gain.
| Design | Studies | Base | Headline effects as published | Direction (our count) |
|---|---|---|---|---|
| Randomized controlled trial | 3 | 207 developers randomized (our calculation) | 19% more task time (METR), 55.8% less (Peng), about 21% less (Google, p=0.086) | 2 faster, with Google's not significant, and 1 slower |
| Field experiment | 1 (three companies) | 4,867 developers analyzed | 26.08% more pull requests pooled, 17.94% to 54.03% by company | 1 higher output |
| Observational telemetry | 3 | More than 10,000 developers and 211 million changed lines | No throughput change (Uplevel), 98% more pull requests merged (Faros), rising copy/paste share (GitClear) | 1 higher output and 1 no change, with 3 of 3 reporting a quality cost |
| Self-reported survey | 3 | About 42,000 respondents (our calculation) | 75% (DORA 2024), more than 80% (DORA 2025) and 52% (Stack Overflow 2025, n=31,636) perceive a gain | 3 of 3 majority perceived gain |
Source: AI Services Companies, AI Coding Productivity Study, October 2026. Bases, counts and directions are our calculations. The survey base adds DORA's approximate counts of 3,000 and 5,000 to Stack Overflow's 33,662. Data: ai-coding-effect-by-design.csv
- The designs that reach the most people rest on the weakest evidence of cause. Claims about speed have to come from the small randomized trials, and claims about scale come from surveys and telemetry that cannot separate the tool from everything else that changed.
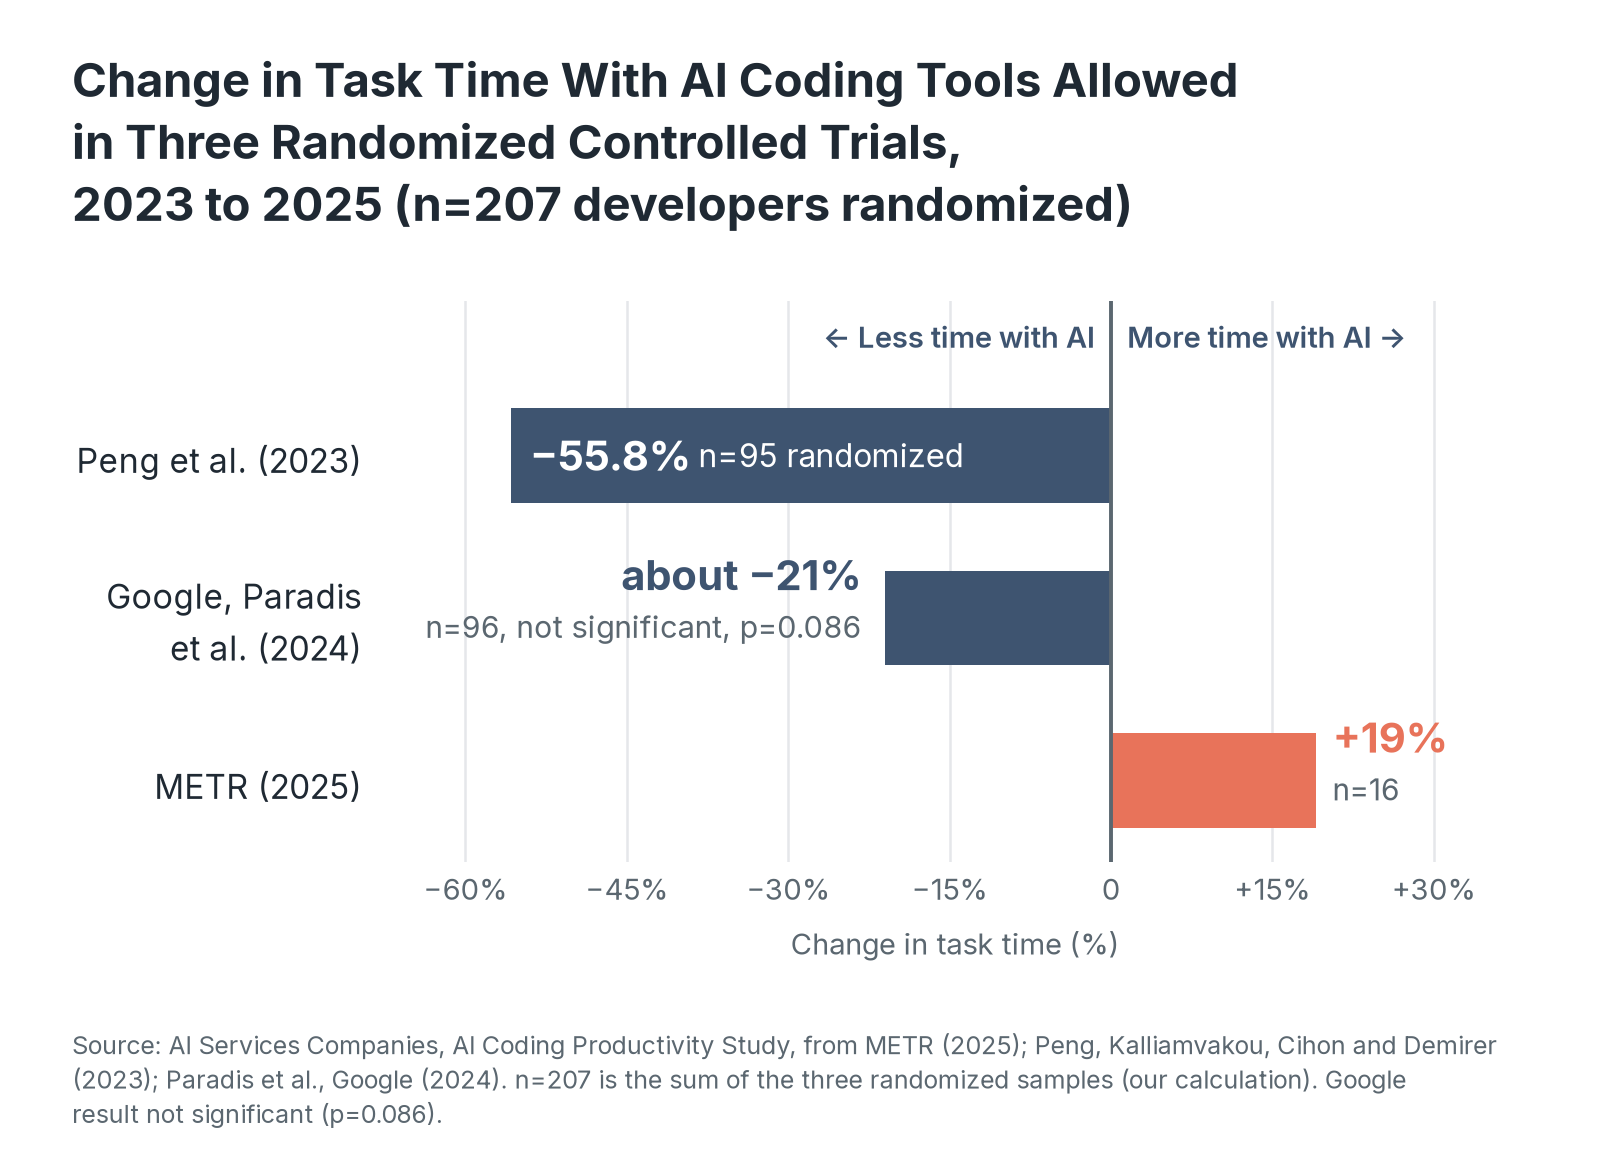
Measured speed effects in the three task-time trials span 74.8 percentage points between the largest cut in task time and the only increase (our calculation, n=3 trials). Two of the three telemetry studies measured throughput and split on it, and all three reported worse results on at least one quality measure. Every outcome in the surveys is the respondent's own report, including the DORA delivery measures.
Randomized Trials of AI Coding Tools on Task Time
This section compares the three trials that timed developers on tasks with and without AI assistance. Each trial assigned AI access at random, and their tasks and participants differ widely.
METR recruited developers who had contributed to large open-source repositories for an average of five years, with the repositories averaging 23,000 stars. Each developer supplied a list of real issues from their own project, and each issue was randomly assigned to allow or disallow AI before work began, giving 136 completed issues with AI allowed and 110 without. Developers mainly used Cursor Pro with Claude 3.5 and 3.7 Sonnet between February and June 2025, and METR paid them $150 per hour. While 93% had used large language models before the study, 44% had prior experience with the Cursor editor (n=16 developers).
| Trial | Participants | Task | Effect on task time | Interval or significance |
|---|---|---|---|---|
| METR (2025) | 16 developers | 246 real issues on their own repositories, averaging 2.0 hours | 19% more time | 95% CI from just above zero to about 40% more time (our reading of METR's Figure 1; METR prints no numeric bounds) |
| Peng et al. (2023) | 95 developers randomized (45 treated, 50 control); task time measured on those who completed the task | Write an HTTP server in JavaScript | 55.8% less time | 95% CI 21% to 89%, p=0.0017 |
| Google, Paradis et al. (2024) | 96 engineers | Add a data logging component to an existing C++ change list of 10 files and 474 lines | About 21% less time | 95% CI on the coefficient from -0.51 to 0.03, p=0.086, not significant |
Source: METR, Measuring the Impact of Early-2025 AI on Experienced Open-Source Developer Productivity (July 2025); Peng, Kalliamvakou, Cihon and Demirer, The Impact of AI on Developer Productivity (February 2023); Paradis et al., How Much Does AI Impact Development Speed? (2024). Data: ai-coding-task-time-rcts.csv
- Each trial's speed figure describes its own setting. A result from one assigned task in an unfamiliar codebase says little about maintainers working through their own backlog, and the reverse holds too.
The GitHub Copilot experiment by Peng and colleagues sent 166 offers through Upwork and randomized the 95 developers who accepted. The authors report that thirty-five developers from both groups completed the task and survey, and the timing comparison uses the developers who completed it. Treated developers finished the JavaScript server task in an average of 71.17 minutes, against 160.89 minutes for the control group, so the control group took more than twice as long (our calculation). Most participants were aged 25 to 34 and lived in India or Pakistan, and the median income band was $10,000 to $19,000. The treated group's success rate was 7 percentage points higher, a difference the authors report as not statistically significant.
Google's trial enrolled 96 full-time engineers in summer 2024 and tested three AI features in its internal development tools. Engineers had to have worked at Google for at least a year and be proficient in C++, and the task asked them to add a data logging component in code they were not familiar with. The mean time on task was 104.4 minutes, and 93 of the 96 participants who started the task completed it (96.9%). The authors estimate that AI cut time on task by about 21%, with a p-value of 0.086, which does not meet the 5% threshold for statistical significance. Of the three trials, Peng's is the only one with a speed gain whose confidence interval excludes zero.
Field Experiments at Microsoft, Accenture and a Fortune 100 Company
This section covers the largest randomized evidence in our dataset, three field experiments in which companies randomized which developers got GitHub Copilot access, or when they got it, during their normal work. Cui, Demirer, Jaffe, Musolff, Peng and Salz report the results in a paper Management Science published online in February 2026.
The Microsoft experiment, involving 1,746 developers primarily located in the United States, began in September 2022 and ended earlier than planned, in April 2023, when control-group developers began to request access. Accenture's experiment started in the last week of July 2023 in a number of offices in Southeast Asia, assigned 61.3% of its 320 developers to treatment and included a training session. Its control group went five months without access, until December 2023. At the anonymous Fortune 100 company, every developer eventually got access, and the experiment randomized when developers were invited to GitHub Copilot, with weekly invites in September and October 2023.
| Experiment | Period | Developers assigned | Developers analyzed | Effect on pull requests | Pull request significance | Build success rate |
|---|---|---|---|---|---|---|
| Microsoft | September 2022 to April 2023 | 1,746 | 1,521 | 27.38% more | Significant at 5% | 1.34% lower, not significant |
| Accenture | Late July to December 2023 | 320 | 316 | 17.94% more | Not significant | 17.40% lower, significant at 5% |
| Fortune 100 electronics maker | September to October 2023 | 3,054 | 3,030 | 54.03% more | Not significant | n/a |
| Pooled, weighted IV | 2022 to 2023 | 5,120 (our calculation) | 4,867 | 26.08% more | Significant at 5% | 5.53% lower, not significant |
Source: Cui, Demirer, Jaffe, Musolff, Peng and Salz, The Effects of Generative AI on High-Skilled Work, Management Science (online February 2026). Figures from the 2025 working paper version. Effects are weighted IV estimates expressed as a percentage of the control mean. The assigned total is our calculation (1,746 + 320 + 3,054). Data: cui-field-experiment-results.csv
- These experiments count work submitted, in pull requests, commits and builds. Their only significant quality result was a decline, so the output gain comes with limited evidence on whether the extra work held its quality.
The analyzed samples are smaller than the assigned groups because the authors kept only software developers at Microsoft and dropped those who switched organizations or adopted Copilot before the experiment, dropped Accenture developers who left the company, and dropped 24 early adopters at the anonymous company. Because compliance with assignment was imperfect, the authors use assignment to treatment as an instrument for Copilot adoption and weight the estimates across experiments. Pooled commits rose 13.55%, which was not statistically significant, and pooled builds rose 38.38%, significant at 1% (n=4,867 developers).
Two of the six authors work at Microsoft, which owns GitHub. The experiments were registered with the AEA RCT Registry as AEARCTR-0014530 after they began.
Telemetry Studies of AI Coding Output and Code Quality
This section reviews three studies that measured AI coding effects from engineering system data without random assignment. Their bases are larger than the trials', and each was published by a company that sells software for measuring engineering work.
Uplevel compared 351 developers with Copilot access and 434 without across several enterprise customers, using January 9 to April 9, 2023 as the before period and January 8 to April 7, 2024 as the after period. It grouped developers by whether they had access, and it describes its results as observational.
| Study | Base | Metric | Measured effect |
|---|---|---|---|
| Uplevel (2024) | 785 developers (our calculation, 351 + 434) | PR cycle time | 1.7 minutes shorter |
| Uplevel (2024) | 785 developers (our calculation, 351 + 434) | PR throughput | No significant change |
| Uplevel (2024) | 785 developers (our calculation, 351 + 434) | Bug rate in pull requests | 41% higher |
| Faros AI (2025) | More than 10,000 developers, 1,255 teams | Tasks completed | 21% more |
| Faros AI (2025) | More than 10,000 developers, 1,255 teams | PR review time | 91% longer |
| Faros AI (2025) | More than 10,000 developers, 1,255 teams | Average PR size | 154% larger |
| Faros AI (2025) | More than 10,000 developers, 1,255 teams | Company-level throughput, DORA metrics and quality KPIs | No significant correlation |
| GitClear (2025) | 211 million changed lines | Moved lines as share of changed lines | 24.1% in 2020 to 9.5% in 2024 |
| GitClear (2025) | 211 million changed lines | Churned lines as share of changed lines | 3.1% in 2020 to 5.7% in 2024 |
Source: Uplevel Data Labs, Can Generative AI Improve Developer Productivity? (September 2024); Faros AI, The AI Productivity Paradox Report 2025 (July 2025); GitClear, AI Copilot Code Quality (February 2025). Uplevel's 785 is our calculation (351 + 434). Data: ai-coding-telemetry-results.csv
- The costs in these studies land after the code is written, on reviewers, testers and maintainers. A productivity measure that counts only what authors produce leaves those costs out of the result.
Uplevel says some of its metrics were statistically significant but that the actual change was inconsequential to engineering outcomes, and it gives the 1.7-minute cut in cycle time as its example. Sustained work outside standard hours fell for both groups over the year, by 17% for developers with Copilot access and by almost 28% for those without.
Faros drew on task management, IDE, static analysis, CI/CD, version control, incident and HR system data from more than 10,000 developers. For each team, it compared the two quarters with the lowest AI adoption against the two with the highest, and it reported only metrics with data from at least six companies and Spearman correlations significant at p<0.05. Team-level gains in Faros's data did not carry through to company-level results. Faros reports that widespread use, above 60% weekly active users, began at most companies only in the two or three quarters before its analysis, that use was highest among engineers newer to their company, and that most developers used only autocomplete features. Developers on high-adoption teams touched 9% more tasks and 47% more pull requests per day.
GitClear classified 211 million changed lines authored from January 2020 to December 2024 into operations such as added, moved, copy/pasted and churned. Its data cover all changed lines in the repositories it tracks, whether a developer or an AI assistant wrote them. GitClear counts a line as churned when it is reverted or substantially revised within two weeks of being pushed, and its 2024 data are the first year in its five-year series in which copy/pasted lines outnumbered moved lines.
DORA Estimates of AI Adoption and Software Delivery
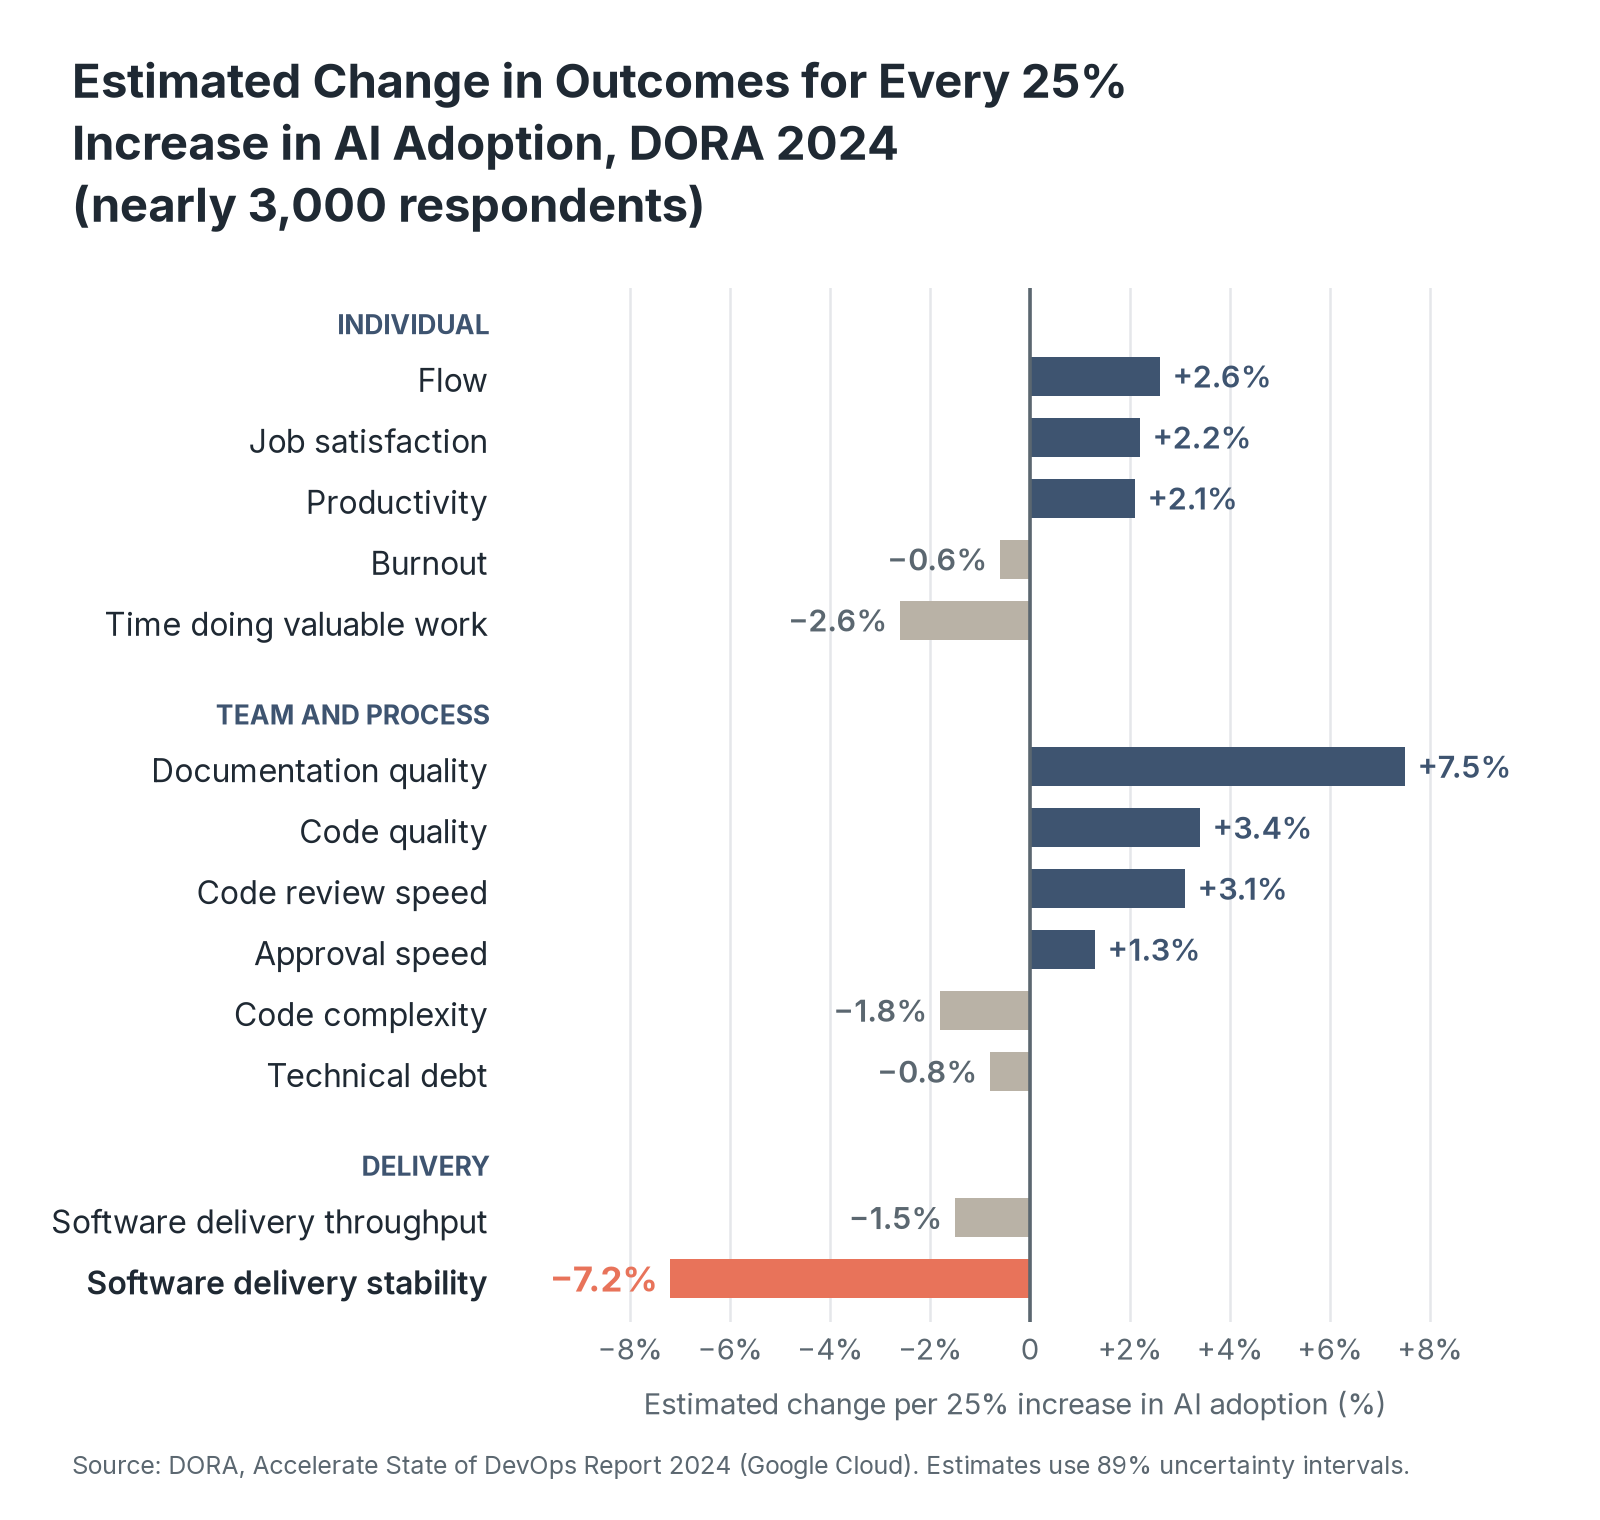
This section reports DORA's 2024 model estimates of how outcomes change as AI adoption rises, and the direction of the 2025 results. DORA measures both adoption and outcomes through its survey, then estimates the change in each outcome for a 25% increase in an individual's AI adoption, using 89% uncertainty intervals.
| Outcome | Level | Estimated change |
|---|---|---|
| Flow | Individual | 2.6% higher |
| Job satisfaction | Individual | 2.2% higher |
| Productivity | Individual | 2.1% higher |
| Burnout | Individual | 0.6% lower |
| Time doing valuable work | Individual | 2.6% lower |
| Documentation quality | Team and process | 7.5% higher |
| Code quality | Team and process | 3.4% higher |
| Code review speed | Team and process | 3.1% higher |
| Approval speed | Team and process | 1.3% higher |
| Code complexity | Team and process | 1.8% lower |
| Technical debt | Team and process | 0.8% lower |
| Software delivery throughput | Delivery | 1.5% lower |
| Software delivery stability | Delivery | 7.2% lower |
Source: DORA, Accelerate State of DevOps Report 2024 (Google Cloud). Data: dora-2024-ai-adoption-estimates.csv
- In DORA's model, most individual and process estimates improve with adoption while both delivery estimates worsen. A team can report better flow, documentation and review speed while the same model links its rising adoption to weaker delivery.
Stability carried the largest delivery estimate in the 2024 model, roughly five times the size of the throughput estimate (our calculation). Documentation quality had the largest positive estimate of the 13 outcomes in the table.
DORA's 2025 report, State of AI-assisted Software Development, drew on survey responses from nearly 5,000 technology professionals and more than 100 hours of qualitative data. Google Cloud's announcement of the report says DORA now observes a positive relationship between AI adoption and both software delivery throughput and product performance, and a continued negative relationship with delivery stability. DORA's explanation is that faster change volume exposes weak testing, version control practices and feedback loops downstream, and that teams with loosely coupled architectures and fast feedback loops see gains while teams in tightly coupled systems see little or no benefit.
Developer Survey Results on AI Coding Productivity, 2024 and 2025
This section collects the adoption, perceived productivity and trust figures from the DORA and Stack Overflow surveys. Each figure is a share of respondents to one question, with the base for that question where the publisher gives it.
| Survey | Base | Measure | Share of respondents |
|---|---|---|---|
| DORA 2024 | Nearly 3,000 | Rely on AI for at least one daily responsibility | 75.9% |
| DORA 2024 | Nearly 3,000 | Moderate or extreme productivity increase | More than one-third (25% moderate, 10% extreme) |
| DORA 2024 | Nearly 3,000 | Little or no trust in AI-generated code | 39.2% |
| DORA 2025 | Nearly 5,000 | Little or no trust in AI-generated code | 30% |
| Stack Overflow 2025 | 33,662 | Use AI tools daily | 47.1% |
| Stack Overflow 2025 | 33,244 | Distrust the accuracy of AI output | 46% (33% trust it) |
| Stack Overflow 2025 | 31,476 | AI solutions almost right, but not quite | 66% |
| Stack Overflow 2025 | 31,476 | Debugging AI-generated code takes more time | 45.2% |
| Stack Overflow 2025 | 12,823 agent users | Agree AI agents increased their productivity | 69% |
Source: DORA, Accelerate State of DevOps Report 2024; Google Cloud, Announcing the 2025 DORA Report (September 23, 2025); Stack Overflow, 2025 Developer Survey, AI section. Data: ai-coding-survey-results-2025.csv
- Wide use and wide distrust appear in the same surveys. An adoption figure shows how many developers use the tools, and it leaves open whether their output improved.
Stack Overflow's 52% figure on productivity comes from a question asking whether AI tools or agents changed how respondents complete development work, answered by 31,636 people. In that question, 16.3% said yes to a great extent and 35.3% said yes somewhat. Among all Stack Overflow respondents, the share using or planning to use AI tools rose from 76% in 2024 to 84% in 2025, and favorable sentiment toward AI tools fell from above 70% in 2023 and 2024 to 60% in 2025.
The share of DORA respondents with little or no trust in AI-generated code fell by about 9 points from 2024 to 2025 (our calculation, nearly 3,000 and nearly 5,000 respondents). Among Stack Overflow respondents, distrust of AI accuracy outweighed trust by 13 percentage points (our calculation, n=33,244). The most common frustration in the Stack Overflow survey was output that is close to correct, and debugging AI-generated code came second (n=31,476).
Self-Reported vs Measured AI Coding Productivity
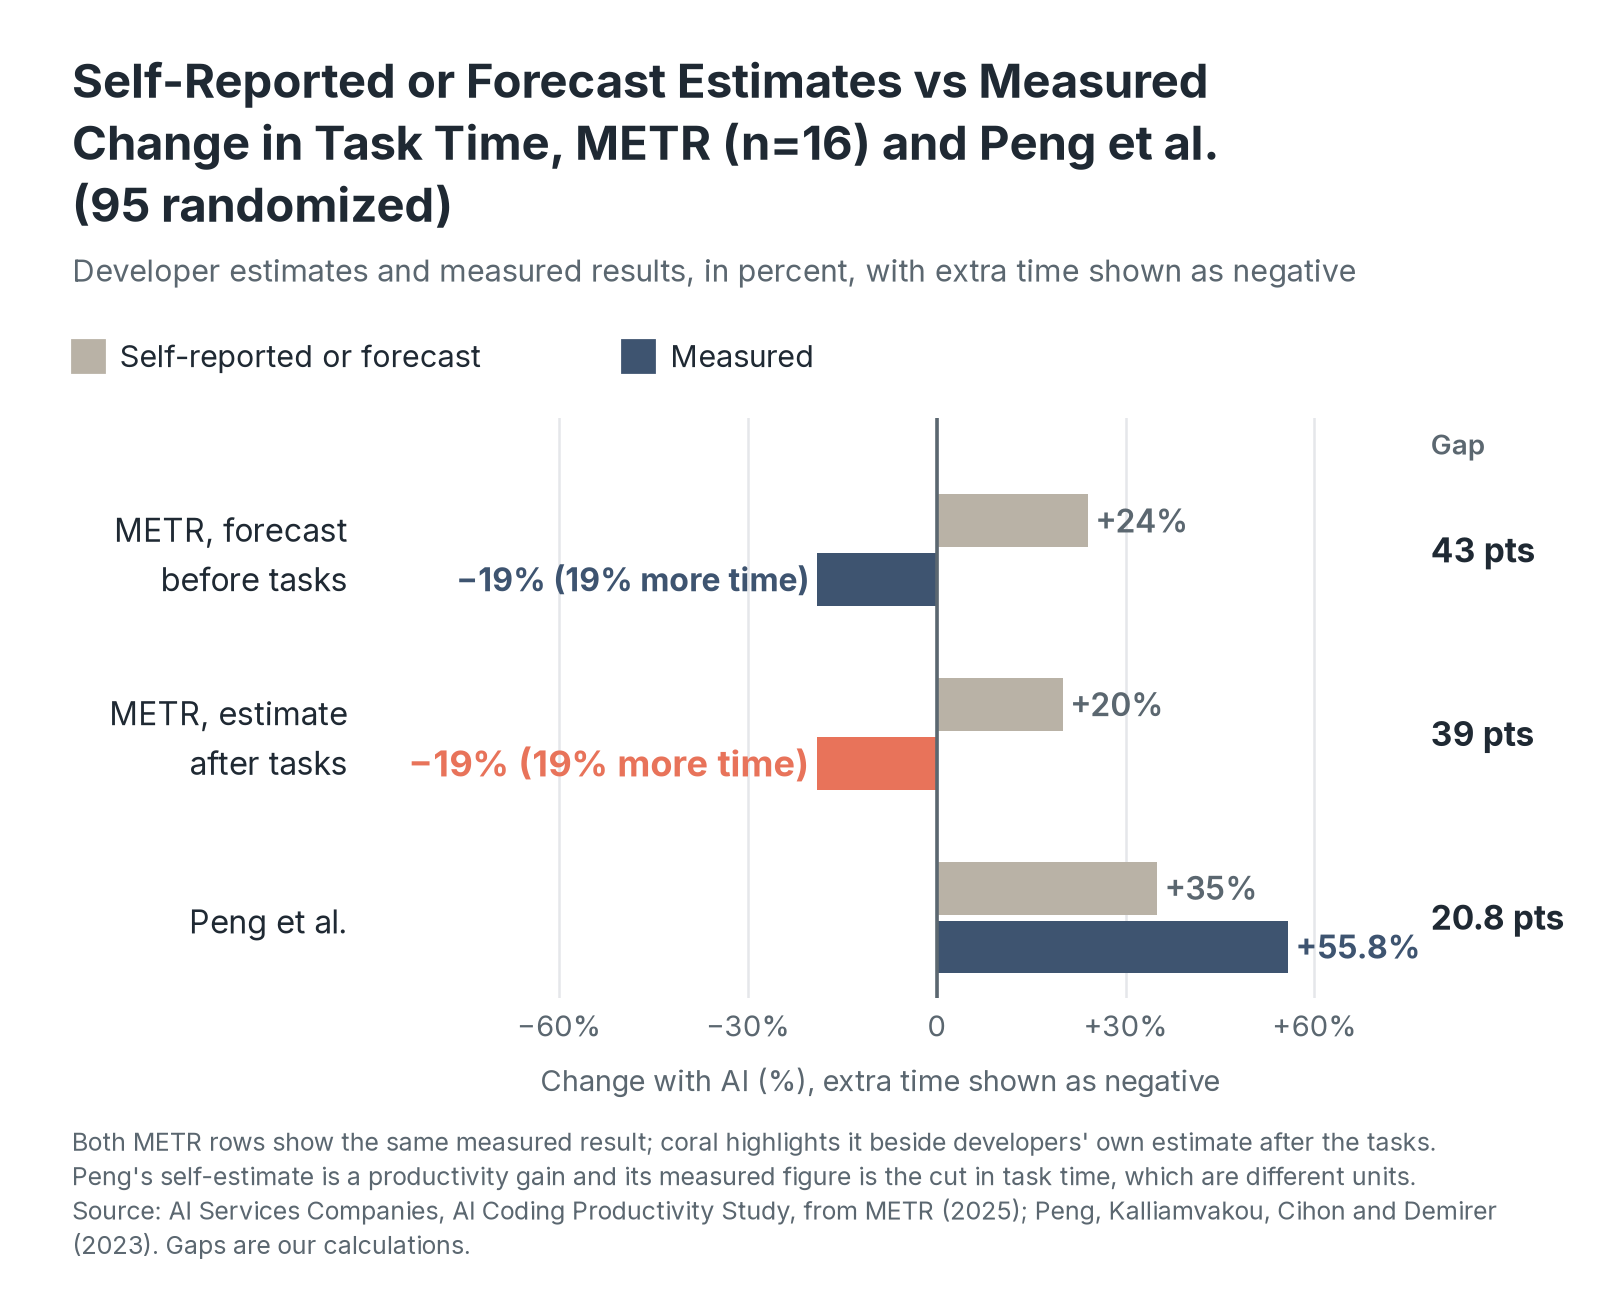
This section compares what developers believed about their speed with what the same study measured. Two studies in our dataset asked participants for a speed estimate and also timed them.
| Study | Base | Self-reported or forecast | Measured | Gap (our calculation) |
|---|---|---|---|---|
| METR (2025), forecast before tasks | 16 developers | 24% less time | 19% more time | 43 percentage points |
| METR (2025), estimate after tasks | 16 developers | 20% less time | 19% more time | 39 percentage points |
| Peng et al. (2023) | Developers who completed the task (of 95 randomized) | 35% productivity gain | 55.8% less time | 20.8 percentage points |
Source: METR (July 2025); Peng, Kalliamvakou, Cihon and Demirer (February 2023). Gaps are our calculations as the difference between the self-reported and measured percentages, with METR's extra time counted as negative time saved. Peng's self-estimate is a productivity gain and its measured figure is a cut in task time, which are different units. Data: ai-coding-self-reported-vs-measured.csv
- METR's developers forecast that AI would cut their task time by 24% and estimated a 20% cut after finishing, while their measured task time rose 19% (n=16). Peng's developers estimated a 35% productivity gain, and the measured cut in task time was 55.8%. A pilot that relies on developers' own sense of speed can overstate or understate the effect.
METR also asked outside experts to forecast the result before the trial. Economics experts predicted AI would cut completion time by 39% and machine learning experts predicted 38%, so both groups expected larger time savings than the developers did. METR's developers still believed AI had sped them up after finishing the tasks, and their post-task estimate differed from their forecast by 4 points (our calculation, n=16).
In the Peng experiment, both the treated and control groups gave an average estimate of a 35% productivity gain, with control participants estimating the gain they would have had with Copilot. The authors describe that estimate as an underestimate of the 55.8% gain they measured, the opposite error from METR's developers.
AI Coding Productivity Evidence by Affiliation
This section groups the 10 studies by the affiliation code from Table 1 and records which designs each group used and what direction its measured results took.
| Affiliation | Studies | Randomized studies | Observational or survey studies | Measured direction (our count) |
|---|---|---|---|---|
| AI tool vendor | 6 | Peng et al., Google, Cui et al. | DORA 2024, DORA 2025, Stack Overflow 2025 | 3 of 3 randomized studies report gains, with Google's not significant (p=0.086) |
| Engineering analytics vendor | 3 | None | Uplevel, Faros, GitClear | 3 of 3 report a quality cost |
| Nonprofit research | 1 | METR | None | 1 of 1 reports a slowdown |
Source: AI Services Companies, AI Coding Productivity Study, October 2026. Affiliation codes and counts are our calculations. Data: ai-coding-affiliation-by-design.csv
- Every randomized study except METR's has at least one author employed by a company that sells AI coding tools. Without an independent trial of the same kinds of tasks, those gains rest on vendor-affiliated research alone and carry less weight than a replicated result.
Three randomized studies found a gain, the Peng and Google trials and the Cui field experiment, and Google's gain did not reach statistical significance. Peng's co-authors came from Microsoft Research, GitHub and MIT Sloan, and all authors of the Google trial work at Google. Two of the six Cui authors work at Microsoft, and the other four are affiliated with Princeton, MIT and the Wharton School. DORA is run by Google Cloud, and Stack Overflow offers an AI-powered VS Code extension with its Stack Internal plans. METR describes itself as a research nonprofit, and Uplevel, Faros and GitClear sell software that measures engineering work. The three analytics vendors used observational designs exclusively.
What AI Coding Productivity Evidence Means Going Forward
AI coding tools can shift effort from the developer who writes the code to the people who review and maintain it.
The tools also change between releases, so each result describes the assistants and workflows its participants used at the time. The evidence so far shows that AI coding tools change how developers write software, and that the size and direction of the effect on productivity differ with the task, the team and the measure.
Data Collection and Methodology
Inclusion. We included published randomized controlled trials and field experiments that measured AI coding tool effects on developer time or output, observational studies drawn from engineering system data across at least several hundred developers or millions of lines of code, and developer surveys with published AI sections and bases in the thousands.
Design codes. A randomized controlled trial assigns AI access at random to developers or tasks under the researchers' control. A field experiment assigns AI access at random inside a company's normal work. Observational telemetry compares developers, teams or time periods using engineering system data without random assignment. A self-reported survey measures outcomes through respondents' own answers, including DORA's modeled estimates, which rest on survey measures of both adoption and outcomes.
Sample, population and metric. Sample is the number of developers, respondents or lines in the analysis the study reports as its main result. For Peng et al. we used the 95 developers randomized. For Cui et al. we used the 4,867 developers in the analysis sample, and we give the assigned and analyzed counts for each company separately. Population describes who the participants were. Metric class is task time, output (pull requests, tasks, commits or builds), code quality (bugs, build success, churn or duplication), delivery (DORA throughput and stability) or perception.
Measured effect. We report each study's headline effect as the authors published it, keeping its sign and unit. Task-time effects are percent changes in time to finish a task, and output effects are percent changes in the count measured. We do not convert time effects into speed multipliers or combine effects across studies, because the metrics differ.
Affiliation. We coded a study as AI tool vendor when any author was employed by, or the publisher was, a company that sells an AI coding tool. We counted Stack Overflow as an AI tool vendor because it offers an AI-powered VS Code extension with its Stack Internal plans, and the extension explains, refactors and analyzes code. We coded engineering analytics vendor when the publisher sells software that measures engineering work and does not sell an AI coding tool. Nonprofit research covers the remaining study. The code records author employment and the publisher.
Our calculations. Gaps between self-reported and measured time savings are the difference between the two percentages, with extra time counted as negative time saved. Base sums add the samples as each study reports them, and DORA's counts of nearly 3,000 and nearly 5,000 are approximate. Percentages are rounded half up to one decimal place unless the source gives a whole number.
Sources (10)
- AI Services Companies, AI Coding Productivity Study: analysis of 10 published randomized controlled trials, field experiments, telemetry studies and developer surveys on AI coding tools (February 2023 to February 2026), coded by design, sample size, population, metric, measured effect and affiliation, conducted October 2026.
- METR, Measuring the Impact of Early-2025 AI on Experienced Open-Source Developer Productivity (Becker, Rush, Barnes and Rein), July 2025
- Peng, Kalliamvakou, Cihon and Demirer, The Impact of AI on Developer Productivity: Evidence from GitHub Copilot, February 2023
- Paradis et al., How Much Does AI Impact Development Speed? An Enterprise-Based Randomized Controlled Trial, Google, 2024
- Cui, Demirer, Jaffe, Musolff, Peng and Salz, The Effects of Generative AI on High-Skilled Work: Evidence from Three Field Experiments with Software Developers, Management Science, online February 2026
- Uplevel Data Labs, Can Generative AI Improve Developer Productivity?, September 2024
- Faros AI, The AI Productivity Paradox Report 2025, July 2025
- GitClear, AI Copilot Code Quality, February 2025
- DORA, Accelerate State of DevOps Report 2024 and Google Cloud, Announcing the 2025 DORA Report, September 23, 2025
- Stack Overflow, 2025 Developer Survey, AI section, with Stack Overflow Support, Install the Visual Studio Code Integration for the affiliation code