
AI Energy Use Statistics 2026
Published November 16, 2026
Our analysts compiled electricity figures from two International Energy Agency reports, the Lawrence Berkeley National Laboratory's study of US data centers from 2014 to 2028, Google's and Microsoft's reported electricity use from 2020 to 2025, and the first per-prompt energy disclosures from Google and OpenAI, to show how much energy AI and the data centers that run it use as of Q4 2026.
Key Findings
- Data centers worldwide used an estimated 485 terawatt-hours (TWh) of electricity in 2025, up 17% from 415 TWh in 2024, and the IEA projects about 950 TWh by 2030, around 3% of global electricity demand.2,3,5
- Electricity use by AI-focused data centers grew 50% in 2025, and the IEA expects it to more than triple to around 465 TWh by 2030.2,3
- US data centers used 176 TWh in 2023, 4.4% of all US electricity, and could use 325 to 580 TWh by 2028, or 6.7% to 12.0%.7
- Microsoft's electricity use rose from 10.8 TWh in fiscal 2020 to 37.0 TWh in fiscal 2025, 3.4 times as much, and Google's data centers used 30.8 TWh in 2024, up 27% in a year.8,9
- The median Gemini Apps text prompt uses 0.24 watt-hours (Wh) of energy, according to Google, and OpenAI puts the average ChatGPT query at 0.34 Wh.2,10
Every AI answer, image, and video is computed on servers in a data center, and those servers, along with the cooling and power equipment around them, run on electricity. The IEA estimates that a typical AI-focused data center uses as much electricity as 100,000 households, and that the largest ones under construction will use 20 times as much. As these facilities spread, surveys show growing public concern about AI's effect on the environment, and utilities and regulators are weighing what data centers do to electricity prices. Estimates of how much energy AI uses still vary widely, partly because few companies report it.2,5 But the figures published since 2025 give a firmer base.
Our analysts read the IEA's Energy and AI report from April 2025 and its Key Questions on Energy and AI update from April 2026. We used the Lawrence Berkeley National Laboratory's 2024 United States Data Center Energy Usage Report for US figures. We took company electricity use from Google's 2025 Environmental Report and Microsoft's 2026 Environmental Data Fact Sheet, and per-prompt energy from Google's August 2025 disclosure and the figures the IEA collected from OpenAI and Microsoft Research. All sources were opened on November 16, 2026.
In the following sections, we compare global data center electricity use and forecasts, growth by region, US data center consumption, energy per AI prompt, the electricity use of Google and Microsoft, and the power sources and emissions behind data centers.
Data Centers Used About 1.5% of the World's Electricity in 2025 and Could Reach 3% by 2030
The IEA publishes the most widely cited global estimates of data center electricity use, built from shipments of servers and the chips inside them. We collected its estimates for 2024 and 2025 and its projections to 2030 and 2035.
| Measure | Period | Value | Publisher |
|---|---|---|---|
| Data center electricity consumption | 2024 | 415 TWh (about 1.5% of global electricity) | IEA, 2025 |
| Data center electricity consumption | 2025 | 485 TWh (slightly more than 1.5%) | IEA, 2026 |
| Growth in data center electricity consumption | 2024 to 2025 | 17% | IEA, 2026 |
| Growth in electricity use by AI-focused data centers | 2024 to 2025 | 50% | IEA, 2026 |
| Average yearly growth in data center electricity consumption | Since 2017 | About 12% a year | IEA, 2025 |
| Projected data center electricity consumption, Base Case | 2030 | About 950 TWh (around 3% of global electricity) | IEA, 2026 |
| Projected electricity use by AI-focused data centers, Base Case | 2030 | Around 465 TWh | IEA, 2026 |
| Projected data center electricity consumption, Base Case | 2035 | Around 1,200 TWh | IEA, 2025 |
| Range across IEA cases | 2035 | 700 to 1,700 TWh | IEA, 2025 |
| Share of global electricity demand growth from data centers | 2024 to 2030 | Less than 10% | IEA, 2026 |
Source: AI Services Companies analysis of IEA, Key Questions on Energy and AI and IEA, Energy and AI data, conducted November 2026. Data: global-data-centre-electricity-2024-2035.csv
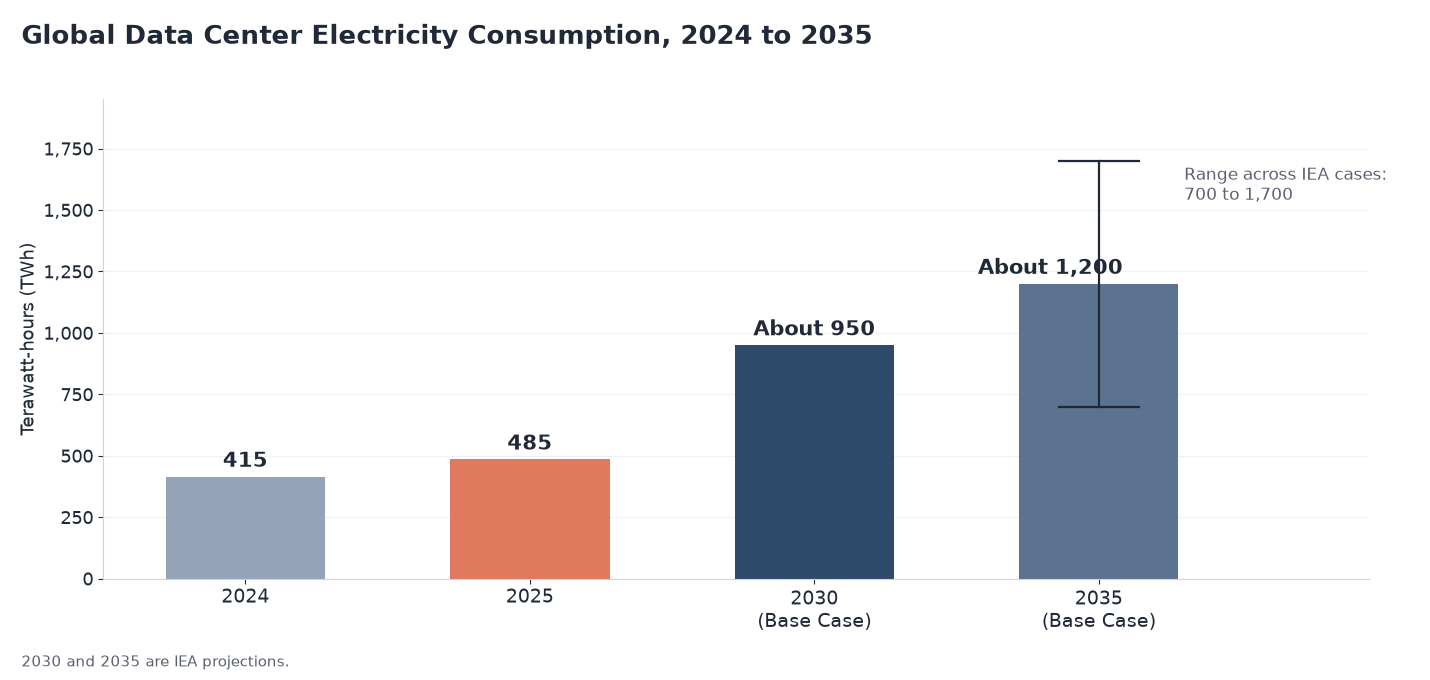
Source: AI Services Companies analysis of IEA data, conducted November 2026.
Key Findings
- Data centers added around 70 TWh of electricity demand from 2024 to 2025. Global electricity demand grew 3% in 2025, so data center use grew more than five times as fast as electricity use overall.2,4
- The IEA kept its 2030 Base Case close to its 2025 forecast. It said shortages of gas turbines, transformers, grid connections, and memory chips make faster near-term growth less likely, even as company spending on data centers keeps rising.2,3
- The range of 700 to 1,700 TWh for 2035 shows how uncertain the long-term outlook is. A figure quoted for 2035 means little without the scenario behind it, and the IEA says it will update its projections regularly.3,5
The United States and China Account for Nearly 80% of Projected Data Center Growth
Data centers cluster in a few countries and, within them, in a few local areas, so the national and local effects differ from the global average. We collected the IEA's regional shares, growth projections, and per-person figures.
| Region | Share of global data center electricity, 2024 | Projected increase to 2030 | Estimated 2024 use | Estimated 2030 use |
|---|---|---|---|---|
| United States | 45% | About 240 TWh (up 130%) | About 187 TWh | About 427 TWh |
| China | 25% | About 175 TWh (up 170%) | About 104 TWh | About 279 TWh |
| Europe | 15% | More than 45 TWh (up 70%) | About 62 TWh | About 107 TWh |
| Japan | Not reported | About 15 TWh (up 80%) | Not reported | Not reported |
Source: AI Services Companies analysis of IEA, Energy and AI: Energy demand from AI and IEA, Energy and AI data, conducted November 2026. Estimated 2024 and 2030 use are our estimates from the IEA shares and projected increases. Data: data-centre-electricity-growth-by-region-2024-2030.csv
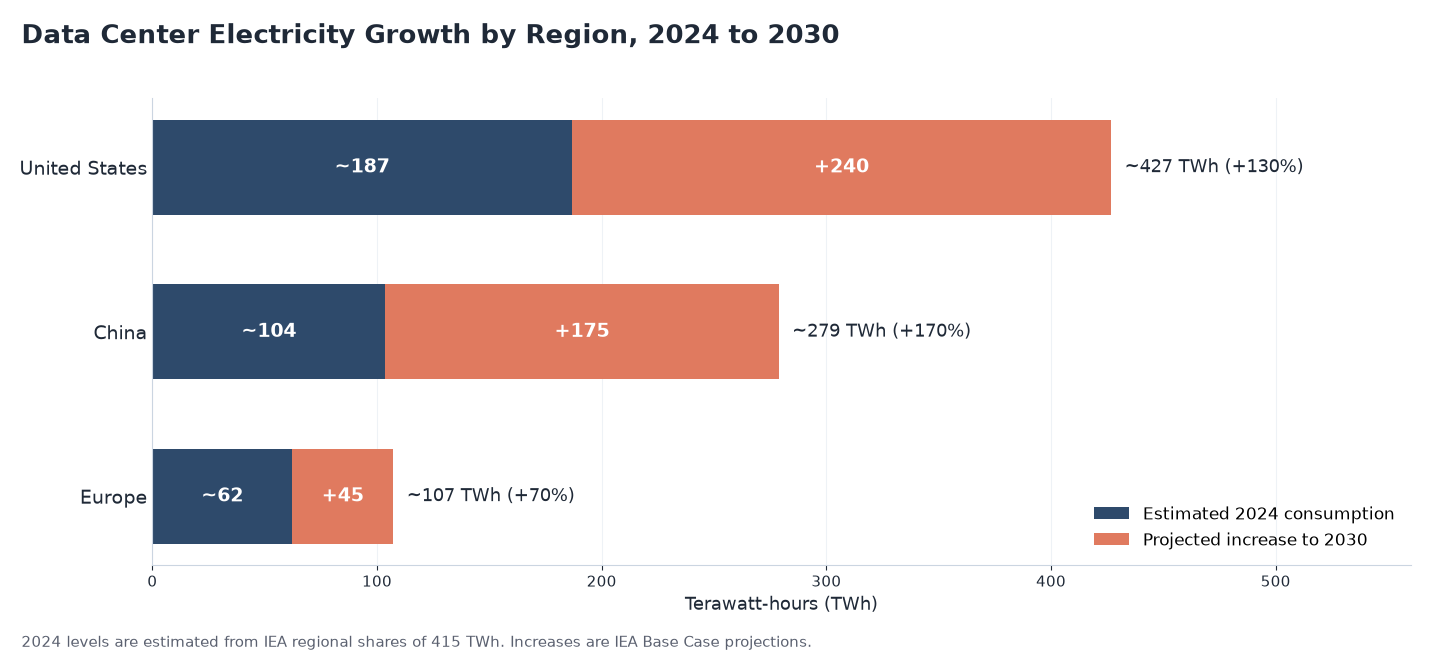
Source: AI Services Companies analysis of IEA data, conducted November 2026.
Key Findings
- The United States has the highest data center electricity use per person, around 540 kilowatt-hours (kWh) in 2024, and the IEA projects more than 1,200 kWh by 2030, roughly 10% of an American household's yearly electricity use. Africa used less than 1 kWh per person in 2024.6
- Data centers used 1.5% of global electricity in 2025 but as much as 20% to 30% of electricity demand in the states, metropolitan areas, or regions where they cluster. In Alberta, Canada, connection requests reached 16 gigawatts (GW), more than the province's peak demand, and the grid operator set a temporary 1.2 GW cap.2
- The IEA estimates that around 20% of planned data center projects could be delayed unless grid risks are addressed. For local grid planning, the regional share is a more useful figure than the global one.5
US Data Centers Used 4.4% of the Country's Electricity in 2023 and Could Use Up to 12% by 2028
The Lawrence Berkeley National Laboratory's report for the US Department of Energy is the main source for US data center electricity use. We collected its yearly estimates, its scenario range for 2028, and its breakdown of how much of the growth came from AI servers.
| Year or period | Measure | Value |
|---|---|---|
| 2014 to 2016 | Total data center electricity use | About 60 TWh a year |
| 2018 | Total data center electricity use | About 76 TWh (1.9% of US electricity) |
| 2023 | Total data center electricity use | 176 TWh (4.4% of US electricity) |
| 2028, scenario range | Total data center electricity use | 325 to 580 TWh (6.7% to 12.0% of US electricity) |
| 2028, scenario range | Equivalent power demand at 50% average utilization | 74 to 132 GW |
| 2017 to 2023 | Electricity use by GPU-accelerated AI servers | Less than 2 TWh to more than 40 TWh |
| 2014 to 2023 | Electricity use by all servers | About 30 TWh to nearly 100 TWh |
| 2023 | Indirect water use from data center electricity | Nearly 800 billion liters |
| 2023 | Greenhouse gas emissions from data center electricity | 61 billion kilograms of CO2 equivalent |
Source: Lawrence Berkeley National Laboratory, 2024 United States Data Center Energy Usage Report, December 2024. Data: us-data-center-electricity-2014-2028.csv
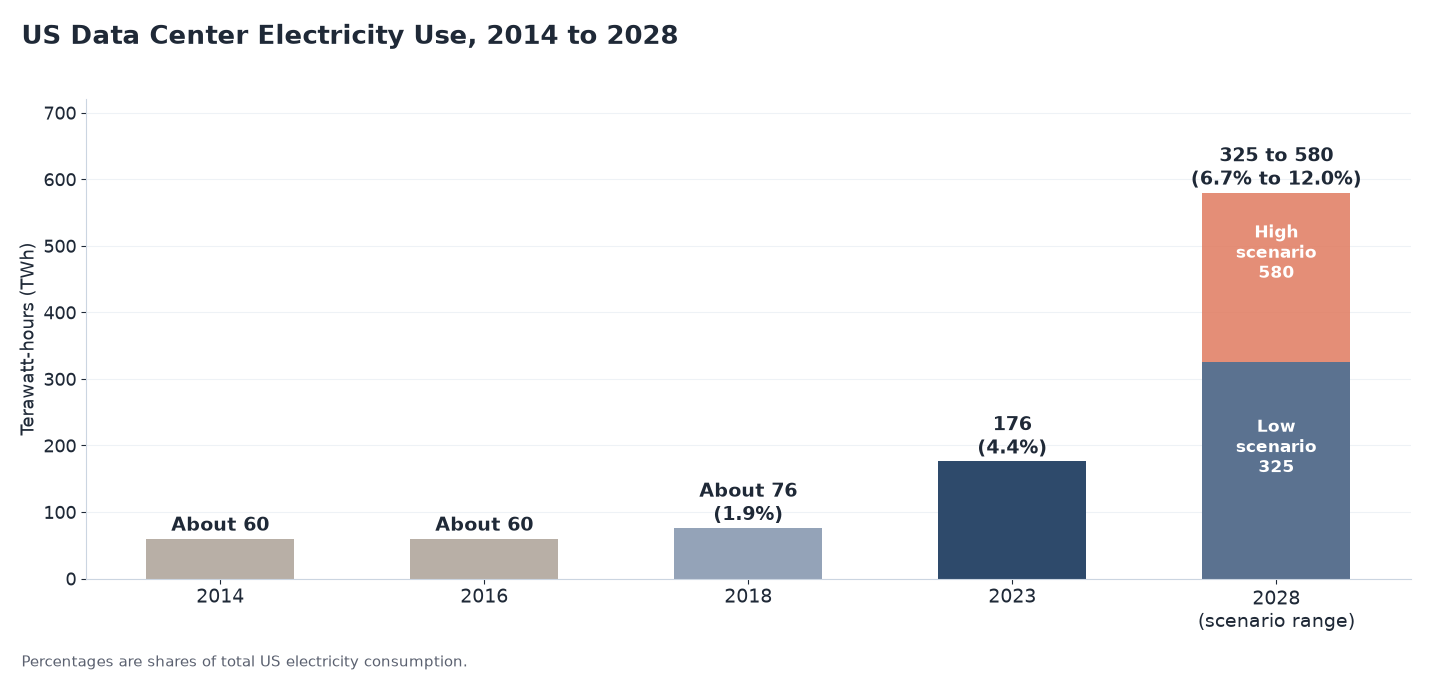
Source: AI Services Companies analysis of Lawrence Berkeley National Laboratory data, conducted November 2026.
Key Findings
- US data center electricity use was flat at about 60 TWh a year from 2014 to 2016, as companies moved computing to more efficient cloud facilities. It began rising in 2017, when GPU-accelerated AI servers became a large enough part of the server stock, and nearly tripled by 2023.7
- AI servers accounted for most of the server growth. Their electricity use rose from less than 2 TWh in 2017 to more than 40 TWh in 2023, while conventional servers about doubled, from about 30 TWh to nearly 60 TWh.7
- The width of the 2028 range, 325 to 580 TWh, comes from uncertainty about how many AI chips will ship, how hard they will run, and how they will be cooled. The low end of the range is nearly double the 2023 level, so even the slowest scenario adds demand that US utilities have to plan for.7
A Typical AI Text Prompt Uses Less Than Half a Watt-Hour, According to Company Disclosures
The energy used by a single AI request is the figure readers most often ask about, and in 2025 the largest AI companies began publishing it. We collected those disclosures and the IEA's estimate of what they add up to at the scale of global internet search.
| Measure | Value | Publisher and date |
|---|---|---|
| Median Gemini Apps text prompt, full accounting | 0.24 Wh of energy, 0.03 grams of CO2 equivalent, and 0.26 milliliters of water | Google, August 2025 |
| Median Gemini Apps text prompt, counting only active AI chips | 0.10 Wh of energy, 0.02 grams of CO2 equivalent, and 0.12 milliliters of water | Google, August 2025 |
| Drop in energy per median Gemini Apps text prompt over 12 months | 33 times lower (44 times lower total carbon footprint) | Google, August 2025 |
| Average ChatGPT query | 0.34 Wh | OpenAI, 2025, as reported by the IEA |
| Median query for frontier-scale models with over 200 billion parameters | 0.34 Wh | Microsoft Research, 2025, as reported by the IEA |
| Yearly electricity for 10 billion AI queries a day at a blended 1 Wh each | About 3.6 TWh | IEA, 2026 |
| Yearly electricity if all conventional internet searches were simple AI text queries | Less than 4 TWh (less than 1% of data center use) | IEA, 2026 |
Source: AI Services Companies analysis of Google Cloud, Measuring the environmental impact of AI inference and IEA, Key Questions on Energy and AI data, conducted November 2026. Data: energy-per-ai-text-prompt-2025.csv
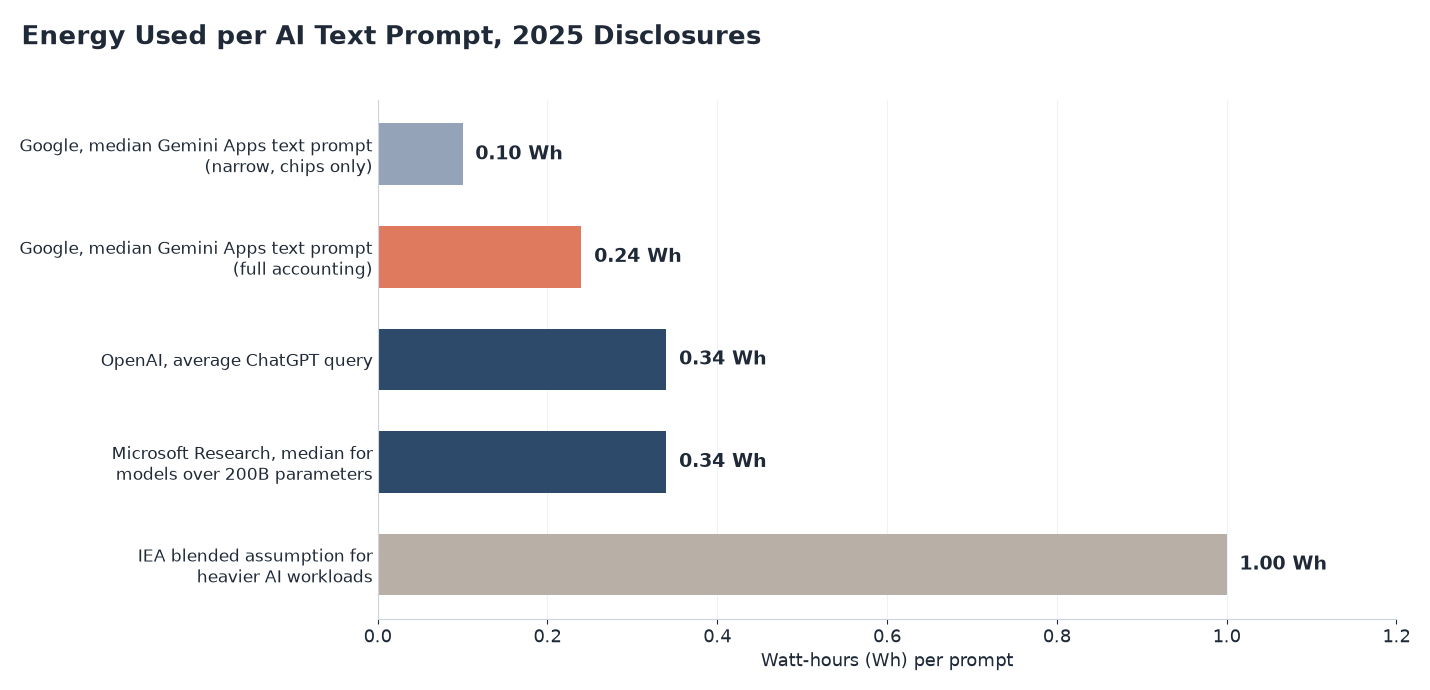
Source: AI Services Companies analysis of Google and IEA data, conducted November 2026.
Key Findings
- Google's 0.24 Wh figure includes idle machines, cooling, and other data center overhead, while its 0.10 Wh figure counts only the AI chips in use. Google said the narrower method substantially underestimates the real footprint, so the two numbers should not be quoted interchangeably.10
- The IEA estimates that energy use per AI task has dropped by at least a factor of 10 a year in recent years. It also says video generation, reasoning, and agent tasks can use hundreds or thousands of times more energy per query than simple text generation.2
- Text prompts at the scale of all internet searches would use less than 1% of data center electricity, according to the IEA, so most planned data center capacity must be meant for model training, image and video generation, and other heavier work. No company that has published per-prompt figures has said how its capacity is split among these uses.2
Microsoft's Electricity Use More Than Tripled From 2020 to 2025
Company sustainability reports give the longest consistent record of how AI demand has changed the power use of the largest cloud and AI providers. We collected Google's data center electricity use and Microsoft's total electricity use for each year they report.
| Year | Google data center electricity | Google yearly change | Microsoft electricity, fiscal year ending June | Microsoft yearly change |
|---|---|---|---|---|
| 2020 | 14.4 TWh | 10.8 TWh | ||
| 2021 | 17.7 TWh | 22% | 13.6 TWh | 26% |
| 2022 | 20.8 TWh | 18% | 18.2 TWh | 33% |
| 2023 | 24.3 TWh | 17% | 23.6 TWh | 30% |
| 2024 | 30.8 TWh | 27% | 29.8 TWh | 27% |
| 2025 | Not yet reported | Not yet reported | 37.0 TWh | 24% |
Source: AI Services Companies analysis of Google, 2025 Environmental Report and Microsoft, 2026 Environmental Data Fact Sheet data, conducted November 2026. Data: google-microsoft-electricity-2020-2025.csv
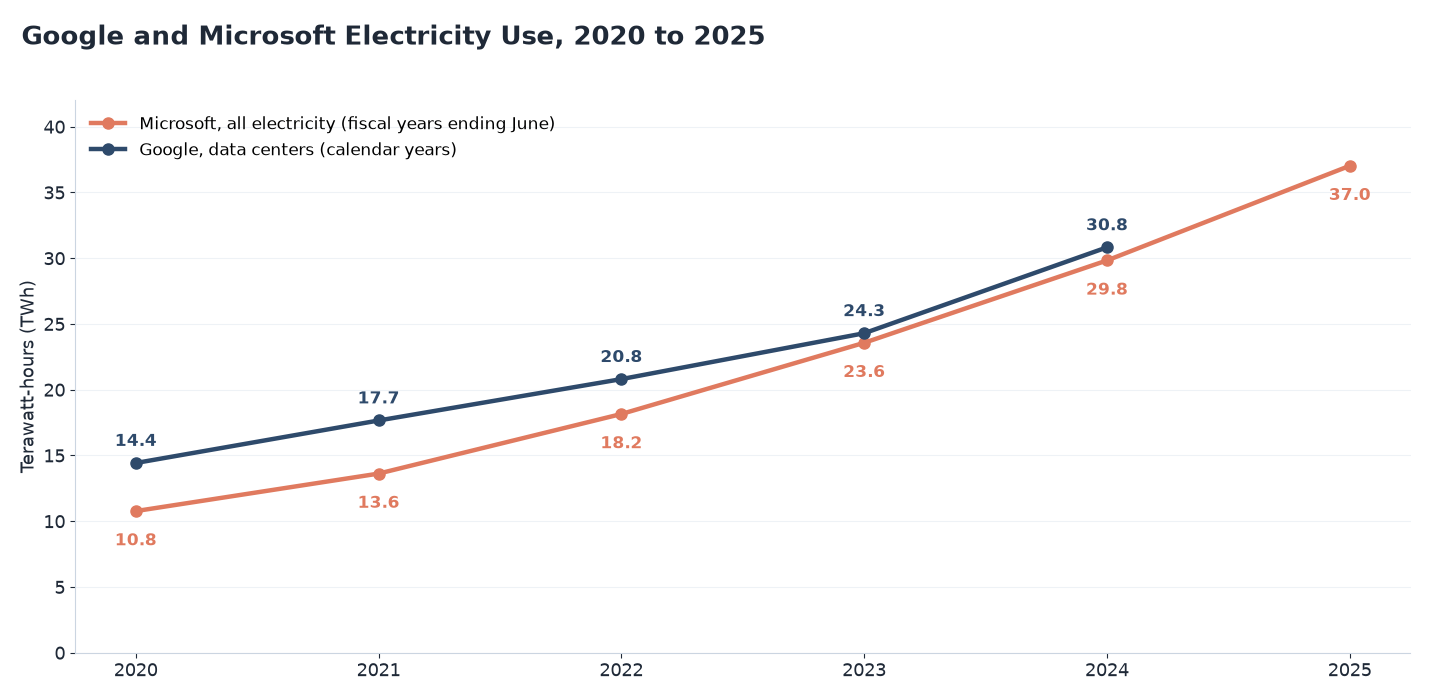
Source: AI Services Companies analysis of Google and Microsoft data, conducted November 2026.
Key Findings
- Amazon Web Services, Microsoft, Alphabet, and Meta together used 110 TWh of electricity in 2024, up 20% from 2023, according to the IEA. That is about a quarter of all data center electricity worldwide that year.2,5
- Google said its data center electricity use grew 27% in 2024 after 17% growth in 2023, and that the growth came from Google Cloud, Search, YouTube, and other services as well as AI. Its data centers had an average power usage effectiveness of 1.09 in 2024, against an industry average of 1.56, meaning less energy went to cooling and power equipment for each unit used by computers.9
- Microsoft's electricity use per million dollars of revenue rose from 75 megawatt-hours in fiscal 2020 to 131 in fiscal 2025, so its power use grew faster than its sales. The IEA reports that five large technology companies spent more than $400 billion on capital projects in 2025 and expect to raise that by 75% in 2026, which points to further growth in company electricity use.4,8
Renewables and Natural Gas Are Set to Supply Most New Data Center Power Through 2030
The climate effect of AI's electricity use depends on how that electricity is generated. We collected the IEA's projections of power sources for data centers, its emissions estimates, and the US figures on emissions and water.
| Measure | Period | Value | Publisher |
|---|---|---|---|
| Electricity generation for data centers | 2030 | More than 1,000 TWh | IEA, 2026 |
| Renewable generation for data centers | 2030 | 360 TWh (more than one-third), up more than 200 TWh | IEA, 2026 |
| Natural gas generation for data centers | 2030 | Around 340 TWh (around 30%), more than double today | IEA, 2026 |
| Nuclear generation for data centers | Today to 2030 | Around 75 TWh to nearly 120 TWh | IEA, 2026 |
| Coal share of data center electricity supply | 2030 | About 20% | IEA, 2026 |
| Renewable power purchase agreements signed by data centers | 2025 | More than 40 TWh, around 40% in the United States | IEA, 2026 |
| CO2 emissions from data center electricity use | Today to 2035, Base Case | 180 million tonnes to 300 million tonnes | IEA, 2025 |
| CO2 emissions from data center electricity use, updated projection | 2035 | Around 350 million tonnes (about 2% of electricity sector emissions) | IEA, 2026 |
| Water intensity of US data center electricity | 2023 | 4.52 liters per kWh (US average 4.35) | Lawrence Berkeley National Laboratory |
| Google data center water consumption | 2024 | 7,787 million gallons |
Source: AI Services Companies analysis of IEA, Key Questions on Energy and AI, IEA, Energy and AI, Lawrence Berkeley National Laboratory, and Google, 2025 Environmental Report data, conducted November 2026. Data: data-centre-emissions-iea-2035.csv
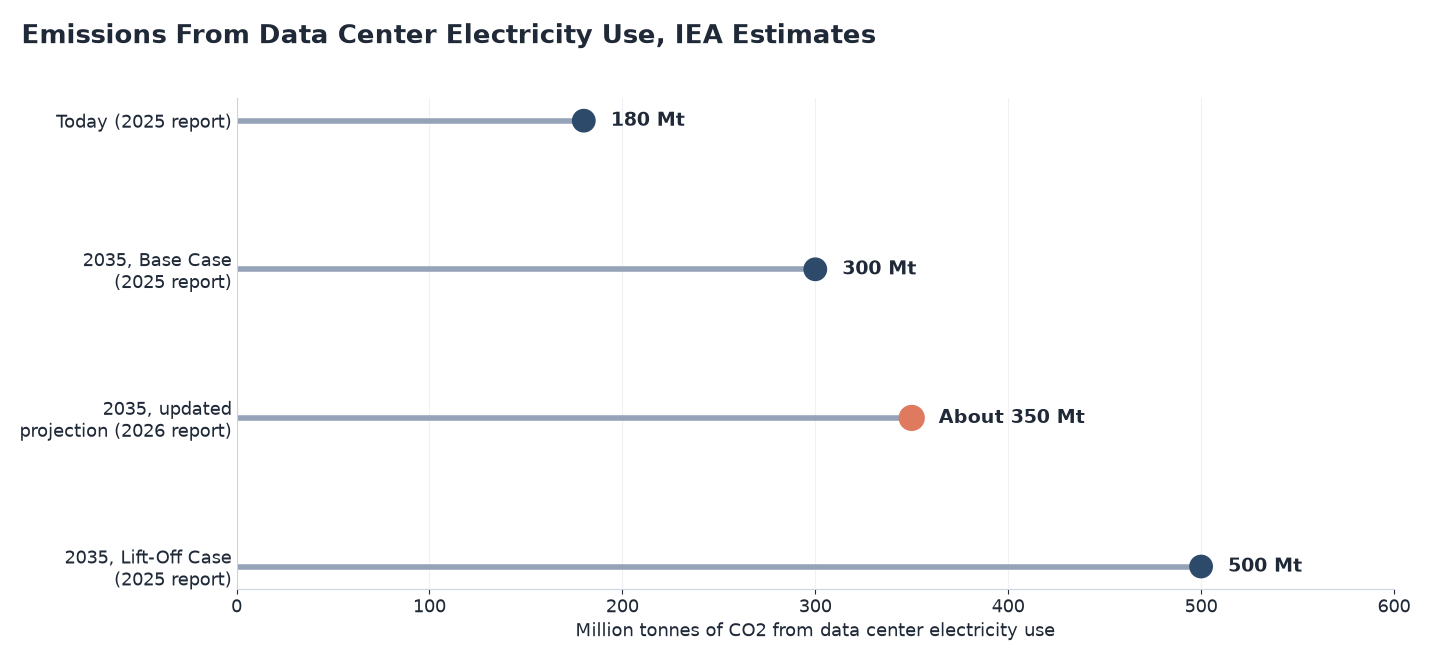
Source: AI Services Companies analysis of IEA data, conducted November 2026.
Key Findings
- Renewables and natural gas together are set to supply more than 65% of electricity for data centers by 2030. Gas growth is concentrated in the United States, and the IEA notes a 70% jump in gas turbine orders in 2025.2
- In Europe, renewable power purchase agreements for data centers rose from about 1.5 TWh in 2021 to nearly 15 TWh in 2025, more than 30% of all electricity contracted through corporate renewable agreements there.2
- The IEA's updated projection of around 350 million tonnes of CO2 in 2035 would still be about 2% of global electricity sector emissions. The 2025 report's gap between the 300 million tonne Base Case and the 500 million tonne Lift-Off Case reflects how much faster AI adoption could grow.2,5
What AI's Energy Use Means Going Into 2027
For most people, the energy used by a single AI prompt is small, a fraction of a watt-hour for a typical text answer. The larger effect is local. Data centers cluster in a few places, and in those places they can account for a fifth or more of electricity demand, which shapes how utilities plan new power plants and grid lines and how those costs reach customers.
Data centers are growing much faster than electricity demand as a whole, and AI-focused facilities faster still. At the same time, the energy used for each AI task is falling quickly. The total depends on which of those trends wins out, and the gap between the IEA's low and high cases for 2035 is 1,000 TWh, roughly twice what all data centers used in 2025.
So if you cite a figure for AI's energy use, say whether it covers all data centers, AI-focused data centers, one company, or a single prompt, and give the year, because the 2025 and 2026 figures for those measures range from 0.24 Wh per prompt to 485 TWh worldwide.
Data Collection and Methodology
Global and regional figures come from the IEA's Energy and AI report (April 2025) and its Key Questions on Energy and AI report (April 2026), downloaded or opened on November 16, 2026. The IEA models data center electricity use from shipments of servers and AI accelerators and reports several cases (Base, Lift-Off, High Efficiency, and Headwinds). We used the 2026 report where it updates a figure (2025 consumption, the 2030 projection, AI-focused data centers, power sources, and the updated 2035 emissions projection) and the 2025 report for figures the update does not restate (2024 regional shares and increases, per-person use, the 2035 consumption range, and the 2035 emissions cases). The IEA describes 2025 consumption both as 485 TWh and as almost 500 TWh; we used 485 TWh. Estimated regional use in 2024 is the regional share multiplied by 415 TWh (for example, 45% of 415 TWh for the United States), and estimated 2030 use adds the IEA's projected increase; both are rounded and labeled as estimates.
US figures come from the Lawrence Berkeley National Laboratory's 2024 United States Data Center Energy Usage Report (December 2024), which models total, server, storage, network, and cooling electricity and presents 2024 to 2028 as a scenario range. Google figures come from the data tables of its 2025 Environmental Report (data center electricity in megawatt-hours, calendar years 2020 to 2024) and its August 21, 2025 blog post on Gemini prompt energy. Microsoft figures are total electricity consumed within the organization, which includes offices as well as data centers, for fiscal years ending June 30, from its 2026 Environmental Data Fact Sheet. Per-query figures from OpenAI and Microsoft Research are as reported by the IEA. Megawatt-hours were converted to terawatt-hours by dividing by 1,000,000. We calculated products, differences, and ratios from the published values.
Sources (10)
- AI Services Companies analysis of data center and AI electricity use from IEA, Lawrence Berkeley National Laboratory, Google, Microsoft, and OpenAI data, 2014 to 2035, conducted November 2026.
- International Energy Agency, Key Questions on Energy and AI (April 2026)
- International Energy Agency, Key Questions on Energy and AI: Executive summary (April 2026)
- International Energy Agency, Data centre electricity use surged in 2025, even with tightening bottlenecks driving a scramble for solutions (April 2026)
- International Energy Agency, Energy and AI: Executive summary (April 2025)
- International Energy Agency, Energy and AI: Energy demand from AI (April 2025)
- Lawrence Berkeley National Laboratory, 2024 United States Data Center Energy Usage Report (December 20, 2024)
- Microsoft, 2026 Environmental Data Fact Sheet
- Google, 2025 Environmental Report
- Google Cloud, Measuring the environmental impact of AI inference (August 21, 2025)