
RAG Implementation Statistics 2026
Published November 11, 2026
Our analysts compared 13 published reports, benchmarks, and price lists released between December 2022 and November 2026, including Menlo Ventures' surveys of 600 and nearly 400 US enterprise leaders, Elastic's survey of 330 IT leaders, three monthly VB Pulse survey waves, and Vectara's hallucination leaderboard of 111 language models, to show how widely companies use retrieval-augmented generation (RAG) as of Q4 2026, how often it still produces wrong answers, and what its core parts cost.
Key Findings
- RAG reached 51% adoption among enterprise AI design patterns in 2024, up from 31% in 2023, while only 9% of production models were fine-tuned (Menlo Ventures, 600 US enterprise leaders).2
- 12% of IT leaders say their organizations have adopted RAG in enterprise search and another 42% plan to within six months, the lowest current adoption of seven AI search capabilities in the survey (Elastic, 2026).4
- Intent to adopt hybrid retrieval tripled from 10.3% to 33.3% of enterprise respondents between January and March 2026, while the share reporting no production RAG system rose from 8.6% to 22.2% (VB Pulse).6
- The median hallucination rate across 111 language models summarizing documents was 9.6% on Vectara's October 22, 2026 leaderboard, and commercial RAG legal research tools hallucinated on more than 17% of Stanford's test queries.8,7
- OpenAI's lowest text embedding price fell 80%, from $0.10 to $0.02 per million tokens, in January 2024 and has not changed since, and Grand View Research estimates the global RAG market at $2.0 billion in 2026.9,10,11,14
A large language model answers from what it learned in training, so on its own it knows nothing about a company's contracts, policies, or support tickets, and it can make up answers that sound right. Retrieval-augmented generation addresses that by searching a company's documents first and handing the most relevant passages to the model along with the question. Most systems find those passages by turning text into lists of numbers called embeddings, stored in a vector database, so the search can match meaning as well as keywords. Since 2023, RAG has become the usual way to build assistants over internal knowledge bases and support content, and in 2026 AI agents use the same retrieval step before they act. Statistics about RAG come from investor surveys, vendor-sponsored studies, academic tests, and price lists, and each counts something different. We wanted the main numbers in one place with their samples and dates.
Our analysts took adoption figures from Menlo Ventures' 2024 and 2026 enterprise AI reports, Elastic's State of Search & AI 2026 survey, Databricks' 2024 State of Data + AI report, and VentureBeat's VB Pulse survey for the first quarter of 2026. We took accuracy figures from Stanford's test of legal research tools and Vectara's hallucination leaderboard, and prices from the published rate cards of OpenAI, Google, and Voyage AI. US results come first wherever a study reports them separately, and all money is in US dollars.
In the following sections, we compare how RAG use has grown since 2023, which AI search capabilities companies have adopted or plan to adopt, how enterprise RAG programs changed in early 2026, how widely companies use vector and hybrid search, how often retrieval-based systems still produce unsupported answers, and what it costs to turn documents into embeddings.
RAG Became the Most Common Enterprise AI Design Pattern by 2024, and Retrieval Use Kept Growing
Several research groups have measured how often companies build AI systems around retrieval, but each one asks a different group of people about a slightly different thing. We set the main measures side by side with the population behind each one, from 2023 through 2026.
| Source | Period | Sample | Measure | Value |
|---|---|---|---|---|
| Menlo Ventures | 2023 | Prior-year survey of US enterprise leaders | RAG share of enterprise AI design patterns | 31% |
| Menlo Ventures | 2024 | 600 US enterprise leaders | RAG share of enterprise AI design patterns | 51% |
| Menlo Ventures | 2024 | 600 US enterprise leaders | Production models that are fine-tuned | 9% |
| Menlo Ventures | 2024 | 600 US enterprise leaders | Implementations using agentic architectures | 12% |
| Databricks | Feb 2023 to Mar 2024 | 10,000+ customer organizations | Companies using generative AI that use tools and vector databases to augment base models | 70% |
| Databricks | Feb 2023 to Mar 2024 | 10,000+ customer organizations | Growth in vector database use, year over year | 377% |
| Menlo Ventures | 2025 to 2026 | Nearly 400 US enterprise decision-makers | AI builders using search infrastructure | 5% to 30% |
| Elastic | 2026 | 330 IT leaders responsible for search | Organizations that have adopted RAG in search | 12% |
| VB Pulse | Mar 2026 | 45 to 58 respondents a month at organizations with 100+ employees | Respondents with no production RAG system | 22.2% |
| Grand View Research | 2026 | Market estimate | Global RAG market size | $2.0 billion |
Source: AI Services Companies analysis of Menlo Ventures 2024, Menlo Ventures 2026, Databricks, Elastic, VB Pulse, and Grand View Research data, conducted November 2026. Data: rag-adoption-trend-2023-2026.csv
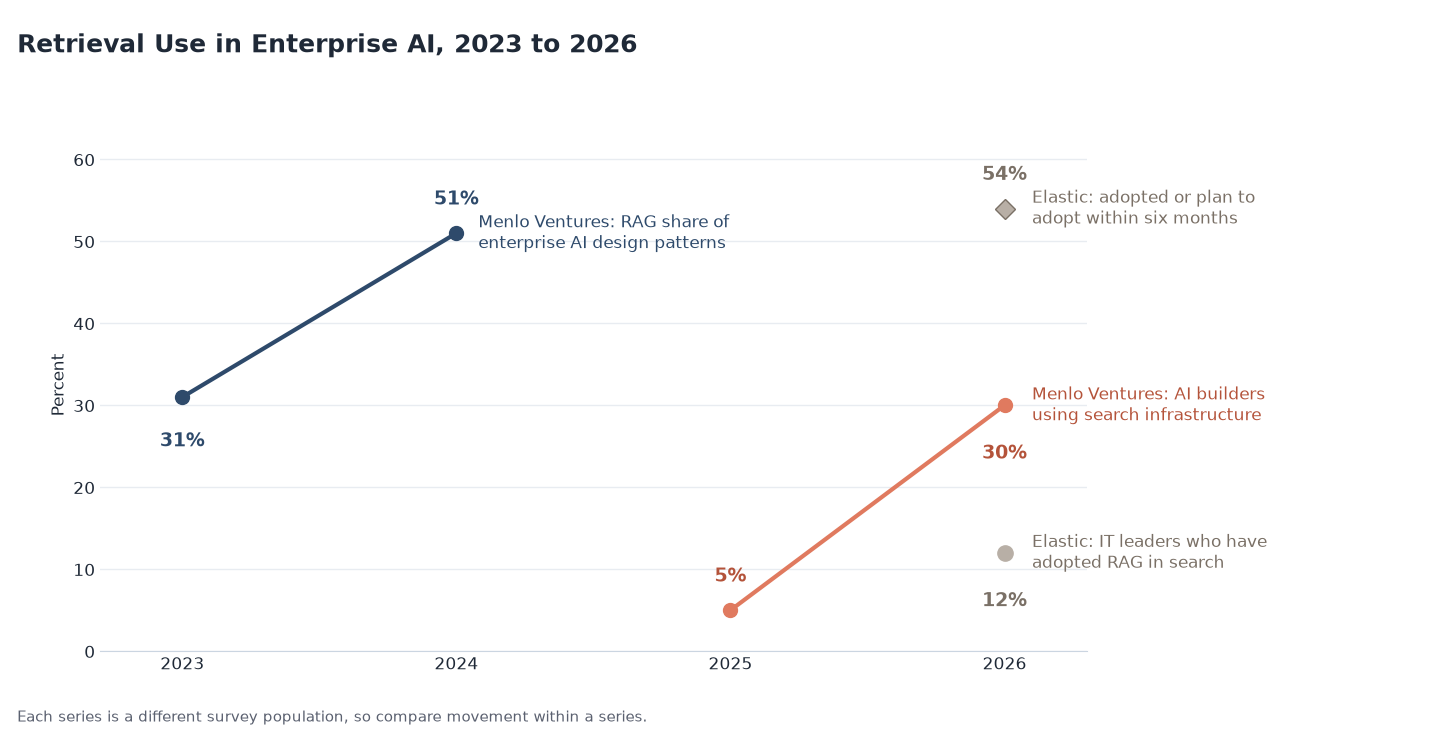
Source: AI Services Companies analysis of Menlo Ventures and Elastic survey results, conducted November 2026.
Key Findings
- Companies chose retrieval far more often than retraining. In Menlo Ventures' 2024 survey, 9% of production models were fine-tuned, against 51% adoption for RAG, and Databricks reported that RAG lets companies add their own current data to a model without the cost and time of fine-tuning or pretraining.2,5
- AI agents are now adding demand for retrieval. Menlo Ventures found that 74% of builders use agents in 2026, that the share using search infrastructure rose from 5% to 30% in one year, and that databases are touched by 91% of AI apps.3
- Grand View Research estimates the global RAG market at $1.2 billion in 2024 and $2.0 billion in 2026, growing at 49.1% a year to $11.0 billion by 2030, with North America holding 36.4% of 2024 revenue. On that estimate, RAG spending would grow 5.5 times between 2026 and 2030.14
Only 12% of Organizations Have Adopted RAG in Search, and Another 42% Plan To Within Six Months
Elastic's 2026 survey asked IT leaders who run enterprise search which AI features they have already added and which they plan to add soon. Putting RAG next to older AI search features such as auto-complete and question answering shows how far along companies are with it.
| Capability | Adopted | Plan to adopt within six months | No plans | Adopted or planned |
|---|---|---|---|---|
| Retrieval-augmented generation (RAG) | 12% | 42% | 26% | 54% |
| Content recommendation engines | 18% | 49% | 18% | 67% |
| Question answering systems | 33% | 41% | 13% | 74% |
| Semantic search and natural language understanding | 26% | 54% | 11% | 80% |
| Auto-complete and query suggestions | 32% | 51% | 17% | 83% |
| Personalized search results | 33% | 53% | 15% | 86% |
| AI-powered search analytics | 25% | 63% | 12% | 88% |
Source: AI Services Companies analysis of Elastic, The State of Search & AI 2026, conducted November 2026. Data: ai-search-capability-adoption-plans-2026.csv
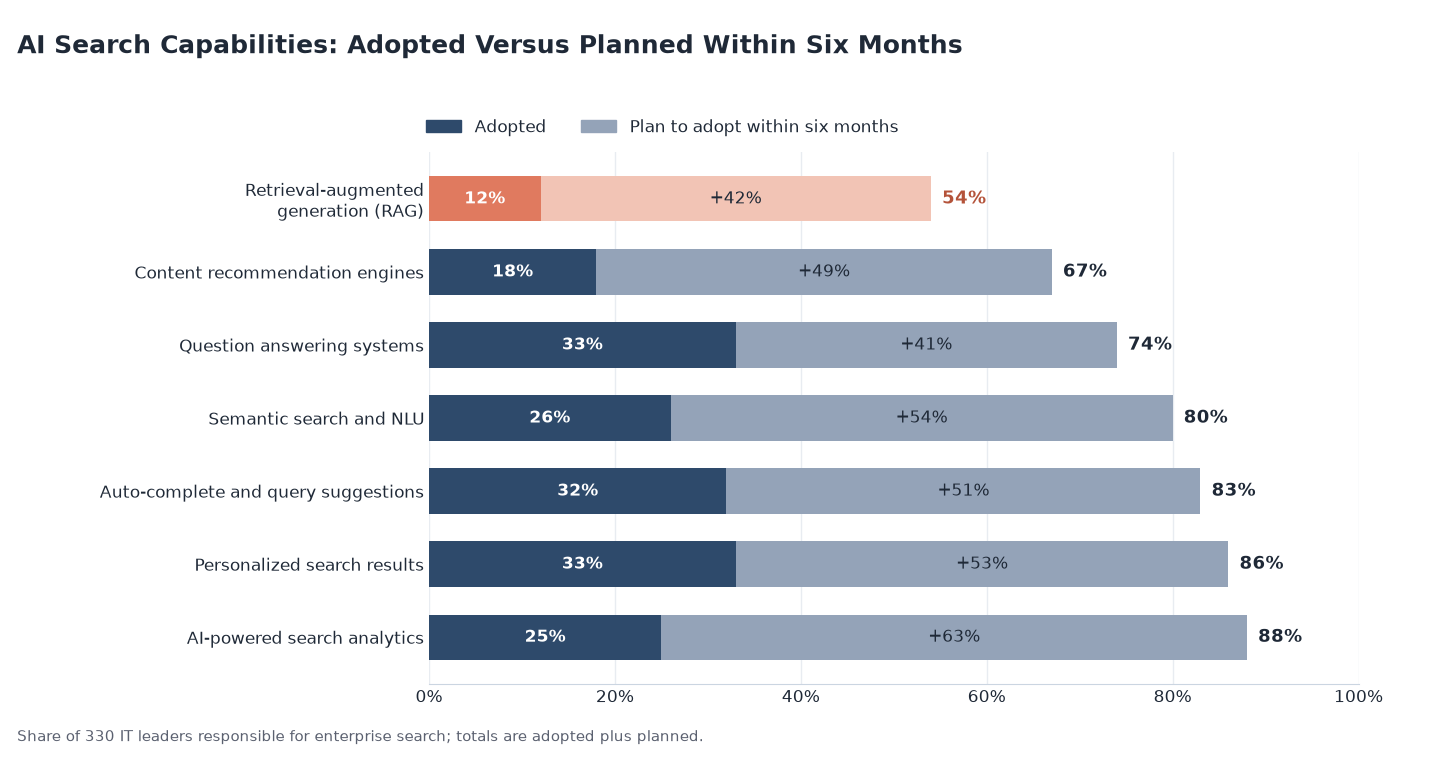
Source: AI Services Companies analysis of Elastic survey results, conducted November 2026.
Key Findings
- RAG had both the lowest adoption and the largest share of organizations with no plans, at 26%, of the seven AI search capabilities in the survey. Question answering systems and personalized search results were the most widely adopted, each at 33%.4
- Most organizations are still testing. Search-powered AI is part of everyday business operations at 6% of organizations, 22% are implementing it, and more than 70% are evaluating or investigating it. 65% of respondents said their AI applications use less than 25% of their organization's data, and 27% said less than 10%.4
- Organizations that started with internal documents reported faster returns. Organizations whose first use case was searching internal knowledge bases reported a 73% implementation success rate against a 61% average, and 62% reached a return on investment within 12 months against 51% overall. 57% of all respondents expect a return within 12 months.4
Enterprise RAG Programs Shifted Toward Hybrid Retrieval in Early 2026
VentureBeat's VB Pulse survey asked enterprise technology buyers each month from January through March 2026 about their RAG plans, budgets, and the way they judge results. Because the same questions ran three months in a row, the survey shows how fast priorities changed inside one quarter.
| Measure | January 2026 | March 2026 | Change |
|---|---|---|---|
| Intend to adopt hybrid retrieval | 10.3% | 33.3% | +23.0 points |
| Retrieval optimization as top growth investment | 19.0% | 28.9% | +9.9 points |
| Evaluation and relevance testing as top investment | 32.8% | 15.6% | -17.2 points |
| No production RAG system | 8.6% | 22.2% | +13.6 points |
| Do not expect large-scale RAG deployment by year-end | 3.4% | 15.6% | +12.2 points |
| Response correctness as an evaluation criterion | 67.2% | 53.3% | -13.9 points |
| Long context as the dominant architecture | 15.5% | 6.7% | -8.8 points |
Source: AI Services Companies analysis of VentureBeat VB Pulse survey results, conducted November 2026. Data: enterprise-rag-shifts-q1-2026.csv
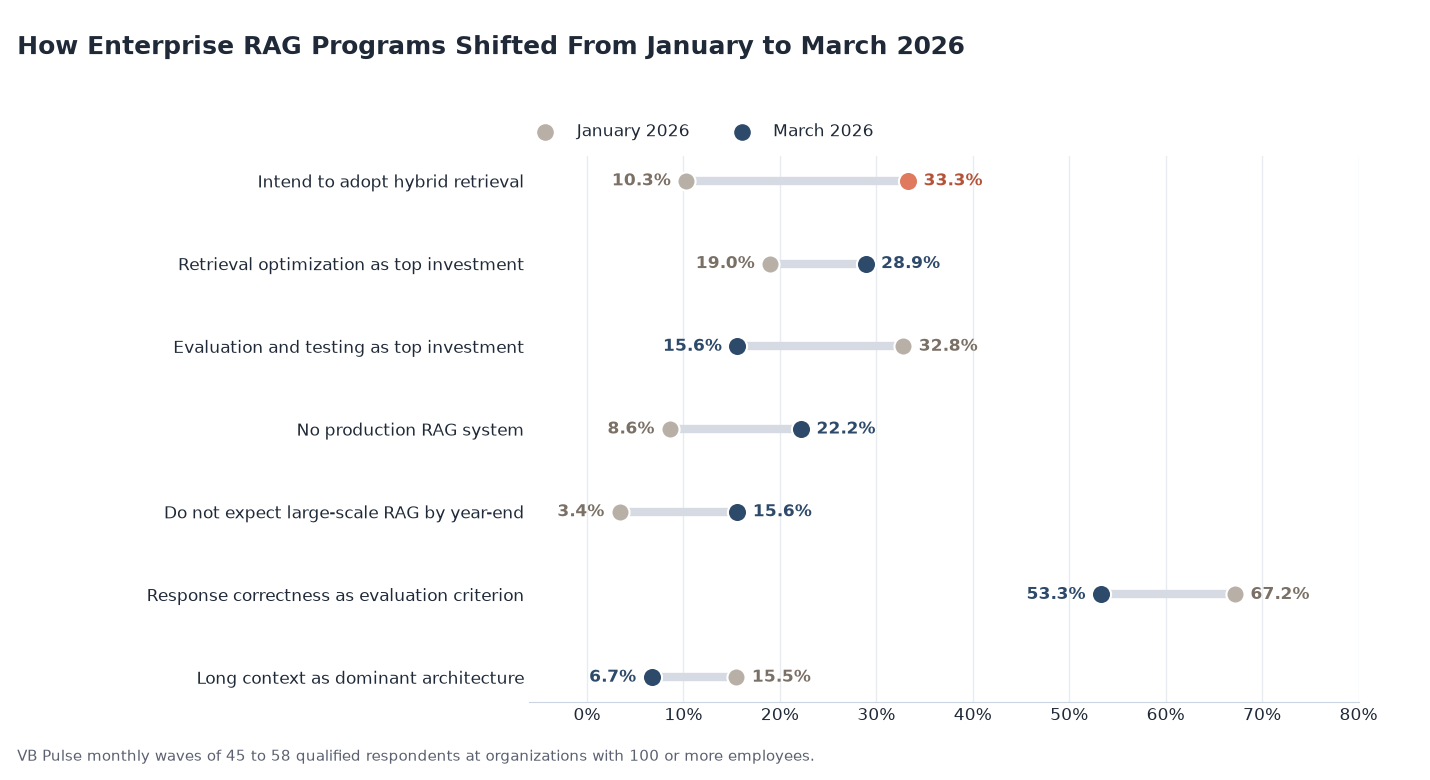
Source: AI Services Companies analysis of VB Pulse survey results, conducted November 2026.
Key Findings
- Hybrid retrieval, which combines vector search with keyword search and a reranking step, became the most common plan. Custom-built retrieval stacks rose to 35.6% of respondents during the quarter, and the standalone vector databases Weaviate, Milvus, Pinecone, and Qdrant each lost adoption share during the quarter.6
- Companies moved budget from testing to fixing. Evaluation and relevance testing fell from 32.8% to 15.6% as the top investment area, while retrieval optimization rose from 19.0% to 28.9%. By March, response correctness, retrieval accuracy, and answer relevance were each used as evaluation criteria by 53.3% of respondents.6
- A growing minority is pausing. Respondents with no production RAG rose from 8.6% to 22.2%, mostly in healthcare, education, and government, and those not expecting large-scale RAG by year-end rose from 3.4% to 15.6%. With 43.1% of respondents entering the quarter planning to expand RAG into more workflows, VentureBeat's data indicates many of those plans changed by March as hybrid retrieval became the most common target.6
Hybrid Search Is Used at 52% of Organizations and Vector Search at 24%
A RAG system is only as good as the search step that feeds it, so the kinds of search a company already runs shape how it builds retrieval. We looked at which search methods organizations use today and which databases enterprises picked to store their embeddings.
| Measure | Source and year | Share |
|---|---|---|
| Keyword search in use | Elastic, 2026 | 82% |
| Full-text search in use | Elastic, 2026 | 69% |
| Hybrid search in use | Elastic, 2026 | 52% |
| Semantic search in use | Elastic, 2026 | 39% |
| Vector search in use | Elastic, 2026 | 24% |
| Visual or image search in use | Elastic, 2026 | 23% |
| Voice search in use | Elastic, 2026 | 16% |
| Pinecone share of enterprise retrieval databases | Menlo Ventures, 2024 | 18% |
| Postgres share of enterprise retrieval databases | Menlo Ventures, 2024 | 15% |
| MongoDB share of enterprise retrieval databases | Menlo Ventures, 2024 | 14% |
Source: AI Services Companies analysis of Elastic and Menlo Ventures survey results, conducted November 2026. Data: search-types-in-use-2026.csv
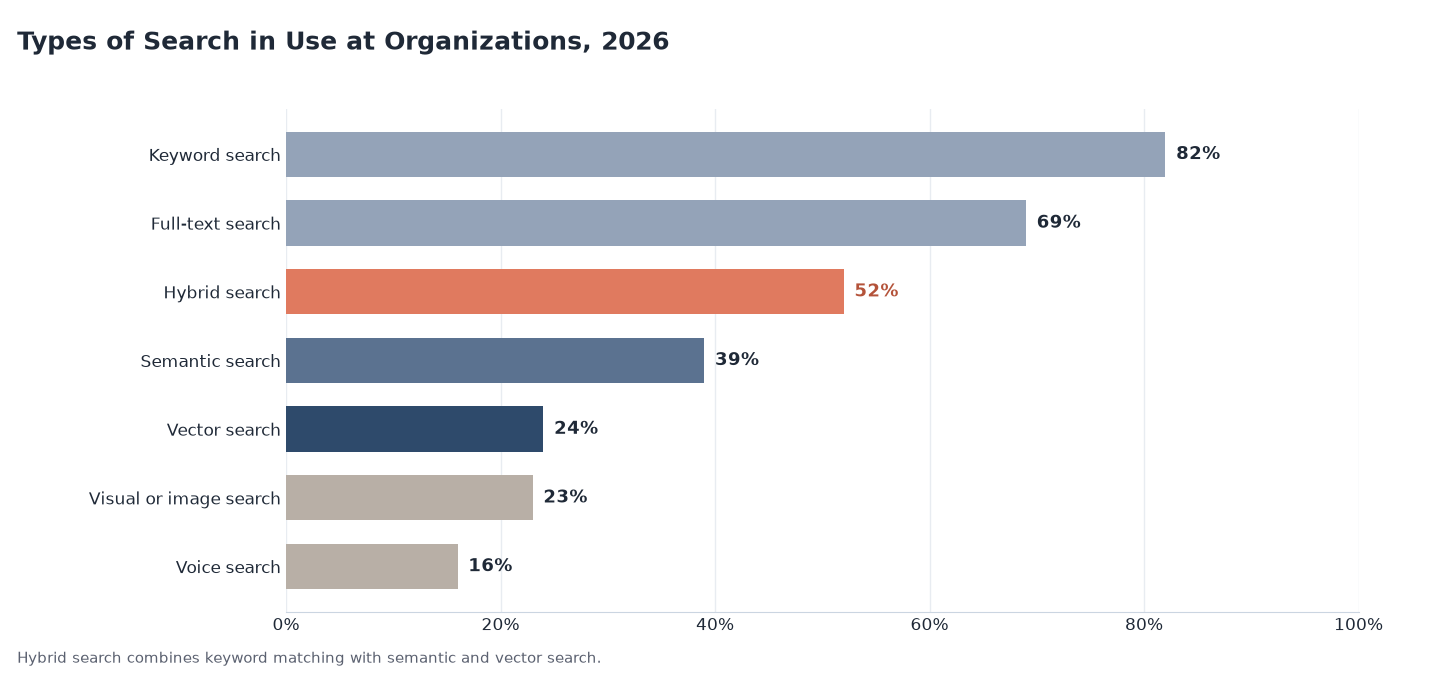
Source: AI Services Companies analysis of Elastic survey results, conducted November 2026.
Key Findings
- Companies that use vector and hybrid search report better results. 63% of Elastic's respondents said these methods make search results more accurate and relevant, a similar share said they raise productivity, and 50% cited faster retrieval across different data sources.4
- Privacy and integration are the main obstacles. The most cited challenges in putting vector and hybrid search in place were data privacy or security (57%), the difficulty of connecting semantic search to existing systems (48%), and a lack of internal expertise (38%), while 20% cited the cost of implementation or upkeep.4
- General databases compete closely with specialist ones. Databricks measured 377% year-over-year growth in vector database use through March 2024, yet Menlo Ventures found Postgres (15%) and MongoDB (14%) almost level with Pinecone (18%) in 2024. In March 2026, the top reason VB Pulse respondents gave for keeping a dedicated vector layer was reliability at scale, at 31.1%.5,2,6
Retrieval-Based AI Systems Still Produce Unsupported Answers in About 1 in 10 Summaries
Companies adopt RAG mainly to get answers grounded in their own documents, so a common question about it is how often those answers are still wrong. We looked at two kinds of evidence: a Stanford study that tested commercial RAG tools on real legal questions, and a public leaderboard that measures how often language models add facts that are not in a document they were asked to summarize.
| System or measure | Test | Hallucination rate |
|---|---|---|
| Westlaw AI-Assisted Research (Thomson Reuters) | Stanford, 200+ legal queries, 2024 | More than 34% |
| Lexis+ AI (LexisNexis) | Stanford, 200+ legal queries, 2024 | More than 17% |
| Ask Practical Law AI (Thomson Reuters) | Stanford, 200+ legal queries, 2024 | More than 17% |
| General-purpose chatbots | Earlier Stanford study of legal queries | 58% to 82% |
| Lowest of 111 models (antgroup finix_s1_32b) | Vectara summary test, Oct 2026 | 1.8% |
| Llama 3.3 70B Instruct | Vectara summary test, Oct 2026 | 4.1% |
| GPT-4.1 | Vectara summary test, Oct 2026 | 5.6% |
| GPT-6 Sol | Vectara summary test, Oct 2026 | 6.5% |
| Gemini 2.5 Pro | Vectara summary test, Oct 2026 | 7.0% |
| Median of 111 models | Vectara summary test, Oct 2026 | 9.6% |
| Claude Opus 5.5 | Vectara summary test, Oct 2026 | 9.9% |
| Highest of 111 models | Vectara summary test, Oct 2026 | 24.2% |
Source: AI Services Companies analysis of Stanford HAI and Vectara Hallucination Leaderboard results, conducted November 2026. Full leaderboard: vectara-hallucination-leaderboard-2026-10-22.csv. Data: vectara-hallucination-leaderboard-2026-10-22.csv
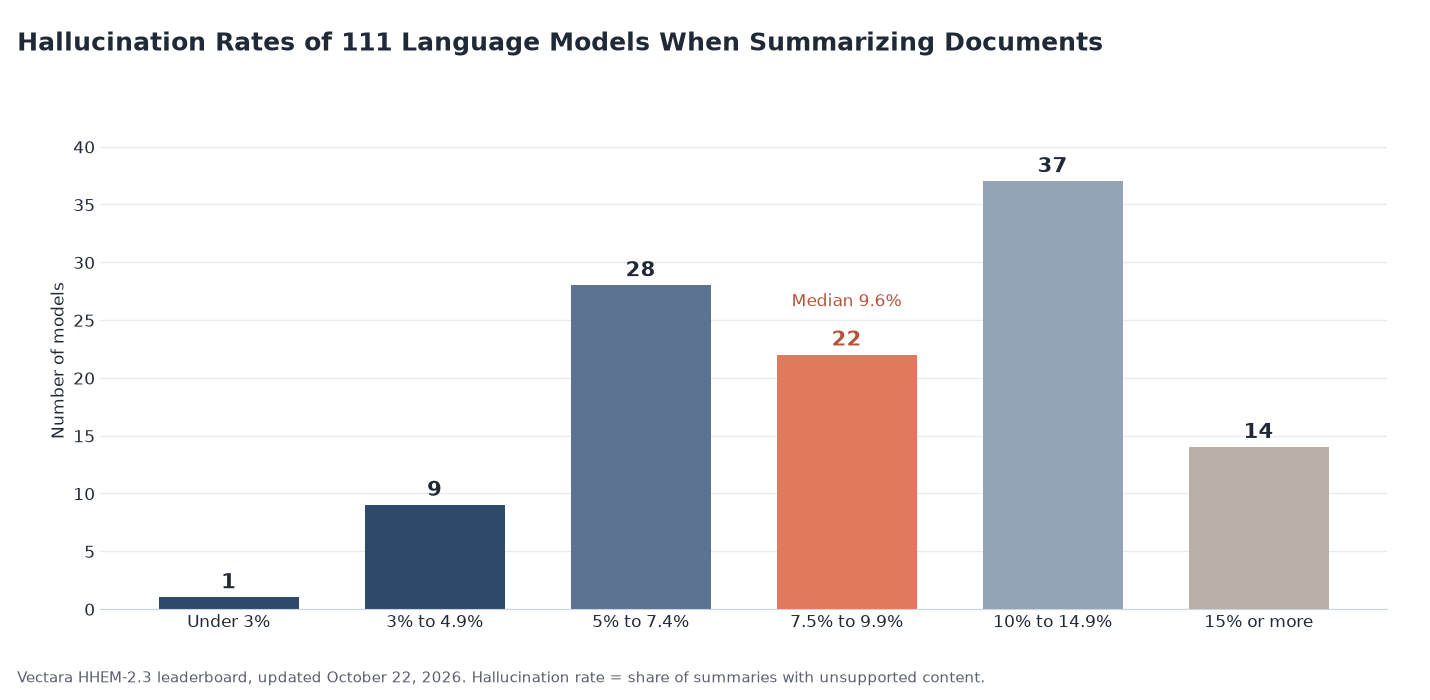
Source: AI Services Companies analysis of Vectara Hallucination Leaderboard results, conducted November 2026.
Key Findings
- Purpose-built RAG tools made fewer errors than general chatbots but still erred often. Stanford's preregistered test of more than 200 legal questions found Lexis+ AI and Ask Practical Law AI gave incorrect information more than 17% of the time and Westlaw's AI-Assisted Research more than 34%, against 58% to 82% for general-purpose chatbots in an earlier study.7
- Even when a model has the source document in front of it, unsupported content is common. 10 of the 111 models on Vectara's leaderboard added unsupported content to fewer than 5% of summaries, while 51 did so in 10% or more, and newer flagship models did not score best: Claude Opus 5.5 was at 9.9% and Gemini 3.1 Pro Preview at 10.4%.8
- Accuracy is now the main measure buyers track. In March 2026, response correctness, retrieval accuracy, and answer relevance were each evaluation criteria for 53.3% of VB Pulse respondents, and companies are moving budget into improving retrieval itself. Retrieval optimization overtook evaluation as the top growth investment area in March, so the next round of spending is going into the search step itself.6
Embedding Prices Fell 80% in 2024 and Range From $0.02 to $0.20 per Million Tokens
Every document a RAG system searches has to be turned into embeddings first, and every incoming question goes through the same step, so the price of an embedding model is a basic unit cost in building one. We collected list prices from three embedding providers and tracked OpenAI's prices since December 2022.
| Provider | Model | Price date | Price per million tokens | Batch price per million tokens | Cost to embed 1 billion tokens |
|---|---|---|---|---|---|
| OpenAI | text-embedding-ada-002 | Dec 2022 | $0.10 | Not shown | $100 |
| OpenAI | text-embedding-3-small | Jan 2024 | $0.02 | Not shown | $20 |
| OpenAI | text-embedding-3-large | Jan 2024 | $0.13 | Not shown | $130 |
| gemini-embedding-001 | Nov 2026 rate card | $0.15 | $0.075 | $150 | |
| Gemini Embedding 2 (text input) | Nov 2026 rate card | $0.20 | $0.10 | $200 | |
| Voyage AI | voyage-3.5-lite | Nov 2026 rate card | $0.02 | Not shown | $20 |
| Voyage AI | voyage-3.5 | Nov 2026 rate card | $0.06 | Not shown | $60 |
| Voyage AI | voyage-3-large | Nov 2026 rate card | $0.18 | Not shown | $180 |
Source: AI Services Companies analysis of OpenAI (December 2022), OpenAI (January 2024), OpenAI pricing, Google Gemini API pricing, and Voyage AI pricing, conducted November 2026. Data: embedding-price-per-million-tokens-2022-2026.csv
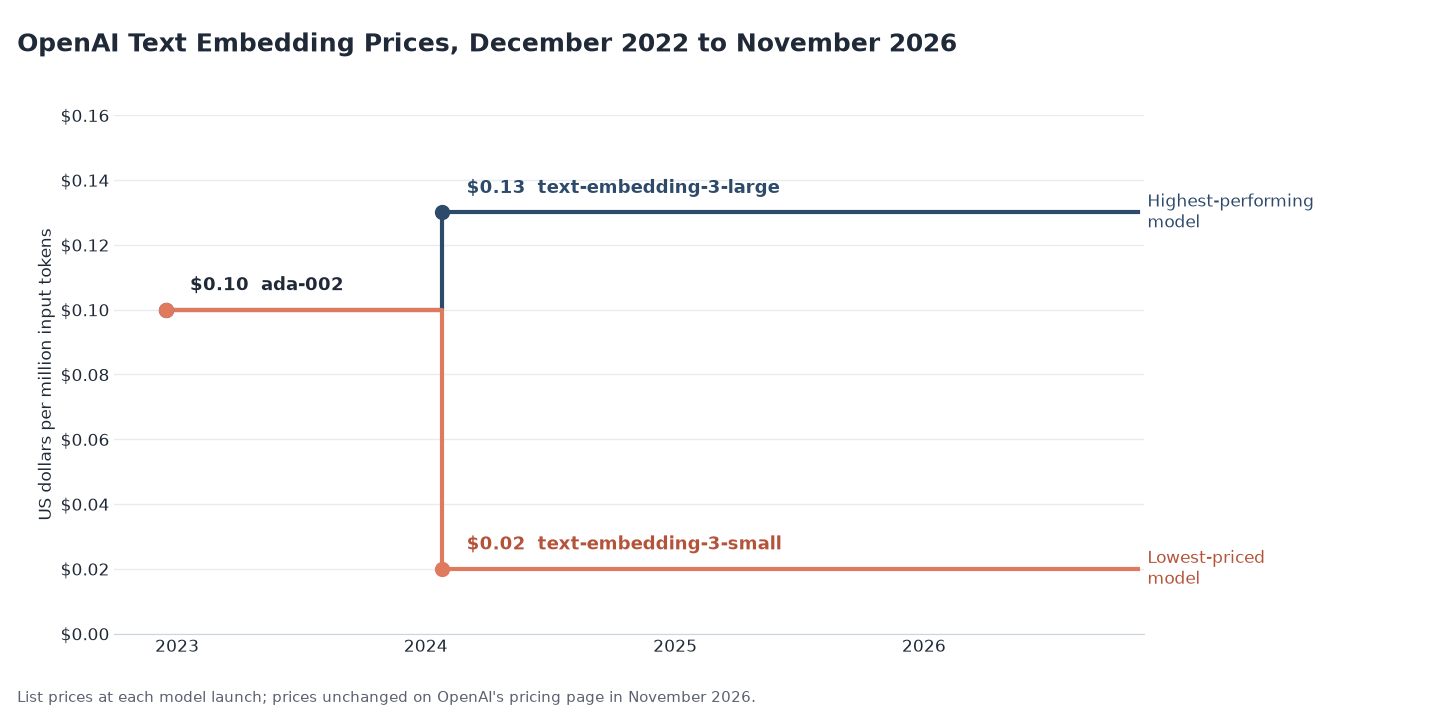
Source: AI Services Companies analysis of OpenAI announcements and pricing, conducted November 2026.
Key Findings
- The price drop came with better results. OpenAI cut its lowest embedding price fivefold, from $0.0001 to $0.00002 per thousand tokens, when it released text-embedding-3-small in January 2024, and the new model raised the average score on the MIRACL multilingual retrieval benchmark from 31.4% to 44.0%. The ada-002 model it replaced had itself been priced 99.8% below OpenAI's earlier Davinci embeddings.10,9
- Embedding one billion tokens of documents costs between $20 and $200 at list prices across the eight models we compared, and Google's batch rates halve its prices for work that does not need an immediate answer.11,12,13
- Generating answers costs far more per token than embedding documents. Menlo Ventures puts the blended price of closed-model tokens at $0.70 per million in 2026, 35 times OpenAI's lowest embedding price, and the average open-source token at $0.13, 6.5 times. Every passage a RAG system sends to the model with a question is billed at those generation rates.3,11
What the RAG Figures Mean Going Into 2027
For companies that use generative AI, retrieval has become the ordinary way to connect a model to their own documents, and it was chosen far more often than retraining models. Yet in Elastic's survey only a small share of organizations run AI-powered search in daily operations, and most AI applications still draw on less than a quarter of a company's data, so most of the work of connecting AI to company knowledge is still ahead.
The 2026 data also shows the first RAG systems being rebuilt. Buyers moved money from testing into better retrieval, hybrid search became the most common plan, and accuracy is still uneven, with more than one in six legal research answers wrong in Stanford's test and a median of nearly one unsupported summary in ten on Vectara's leaderboard. As AI agents take on more tasks, more of them depend on a search step: the share of AI builders using search infrastructure rose sixfold in 2026, while OpenAI's lowest embedding price has not changed since January 2024.
So if you cite a RAG adoption rate, give the source, the date, and whether it counts design patterns, search features, or production systems, because 2026 figures range from 12% to 77.8% on those differences alone.
Data Collection and Methodology
We collected published percentages, counts, and prices from 13 reports, benchmarks, and price lists. Surveys: Menlo Ventures' 2024 State of Generative AI in the Enterprise (600 US IT decision-makers at enterprises with 50 or more employees, surveyed September 24 to October 8, 2024; its 2023 comparison figure comes from the prior-year survey as reported in the 2024 report); Menlo Ventures' 2026 State of Enterprise AI (nearly 400 US enterprise decision-makers, fielded by Morning Consult from September 8 to 26, 2026); Elastic's State of Search & AI 2026 (330 IT leaders with responsibility for search, conducted by ViB Research and sponsored by Elastic; half work at companies with more than 5,000 employees); and VentureBeat's VB Pulse survey (three monthly waves from January to March 2026, 45 to 58 qualified respondents a month at organizations with 100 or more employees, which VentureBeat describes as directional). The VB Pulse hybrid retrieval figures are the start-of-quarter and end-of-quarter values VentureBeat reported for the first quarter.
Databricks figures come from usage data across more than 10,000 customer organizations from February 1, 2023, to March 31, 2024, measured by number of customers. Stanford's figures come from a preregistered set of more than 200 open-ended legal queries run on mid-2024 versions of each tool. Vectara's leaderboard uses its HHEM-2.3 model to score summaries of short documents produced at temperature 0, and counts a summary as a hallucination when it contains content the document does not support; we grouped all 111 listed models into rate bands. Prices are list prices per million input tokens taken from each provider's announcement or pricing page; OpenAI's 2022 and 2024 prices were published per thousand tokens and are shown per million. The Grand View Research market size is a modeled estimate.
Survey measures differ in wording, sample, and time window, so we show each figure with its own source and do not average them. The 77.8% figure is the share of March 2026 VB Pulse respondents who did not report having no production RAG system. We calculated products, differences, and ratios from the published values.
Sources (14)
- AI Services Companies analysis of retrieval-augmented generation adoption, accuracy, vector search, and embedding price data from 13 published reports, benchmarks, and price lists, conducted November 2026.
- Menlo Ventures, 2024: The State of Generative AI in the Enterprise (November 20, 2024)
- Menlo Ventures, 2026: The State of Enterprise AI (November 2026)
- Elastic, The State of Search & AI 2026: Insights from 330 IT leaders (2026)
- Databricks, 2024 State of Data + AI (June 2024)
- VentureBeat, The retrieval rebuild: VB Pulse survey data, January to March 2026 (April 29, 2026)
- Stanford HAI, AI on Trial: Legal Models Hallucinate in 1 out of 6 (or More) Benchmarking Queries (May 23, 2024, updated May 30, 2024)
- Vectara, Hallucination Leaderboard, HHEM-2.3 (updated October 22, 2026)
- OpenAI, New and improved embedding model (December 15, 2022)
- OpenAI, New embedding models and API updates (January 25, 2024)
- OpenAI, API pricing (accessed November 11, 2026)
- Google, Gemini Developer API pricing (accessed November 11, 2026)
- Voyage AI, Pricing (accessed November 11, 2026)
- Grand View Research, Retrieval Augmented Generation Market Report, 2025 to 2030